
TradingView 101
-
Get the TradingView App on your phone & computer.
Register your account.
You may use the free access version, we recommend to upgrade to allow access to additional indicators and features, but it is not necessary.
-
TradingView is an amazing app with charts available for crypto, stocks, metals, commodities, currencies, bonds, indexes, ETFs, government policy rates, and more.
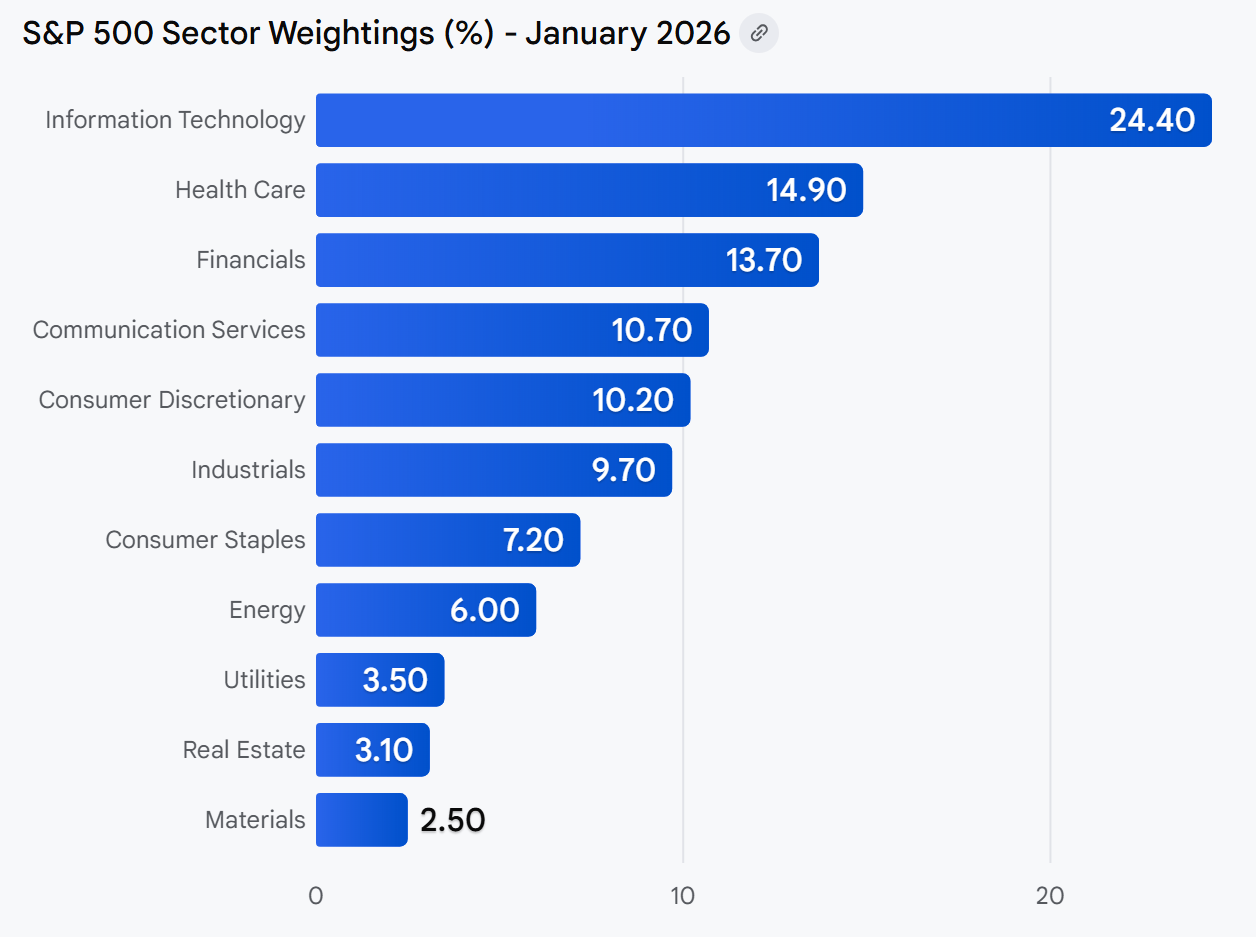
To approach your trades with a clear mind, we highly recommend you to declutter and create Lists on TradingView of the 12 Sectors of Industry +1 for your Active Positions, & more. See below for examples
-
Favorite the Indicators you will frequently use.
See our list of preferred indicators and submit your TradingView username to be granted access to our Invite-Only Indicators!
-
Learn the NCL Way and practice drawing with rays, parallel channels, & more.
AMZN
HD
BABA
Consumer Discretionary
12 Sectors Watchlist Examples
MCD
DIS
SBUX
Consumer Services
WMT
COST
KO
Consumer Staples
XOM
CVX
SHEL
Energy
BRK-B
JPM
BAC
Financials
LLY
JNJ
ABBV
Health Care
CAT
GE
BA
Industrials
NVDA
AAPL
MSFT
IT
LIN
BHP
SHW
Materials
WELL
PLD
AMD
Real Estate
NEE
DUK
SO
Utilities
Other Lists to Consider
Soybeans
Cattle
Crude Oil
Commodities
BTC
ETH
SOL
Crypto
EUR/USD
USD/JPY
GBP/USD
Forex
DJIA
QQQ
SPY
Index
DXY
T10Y3M
MOVE
Macro
GOLD
SILVER
COPPER
Metals
BTC
SPY
BAC
Active Positions (any active trades)
Creative Lists
WMT
DG
NFLX
Recession Proof
LMT
NOC
XOM
War Time
GME
AMC
TSLA
Memestocks
ETH
SOL
SUI
L1 Blockchains
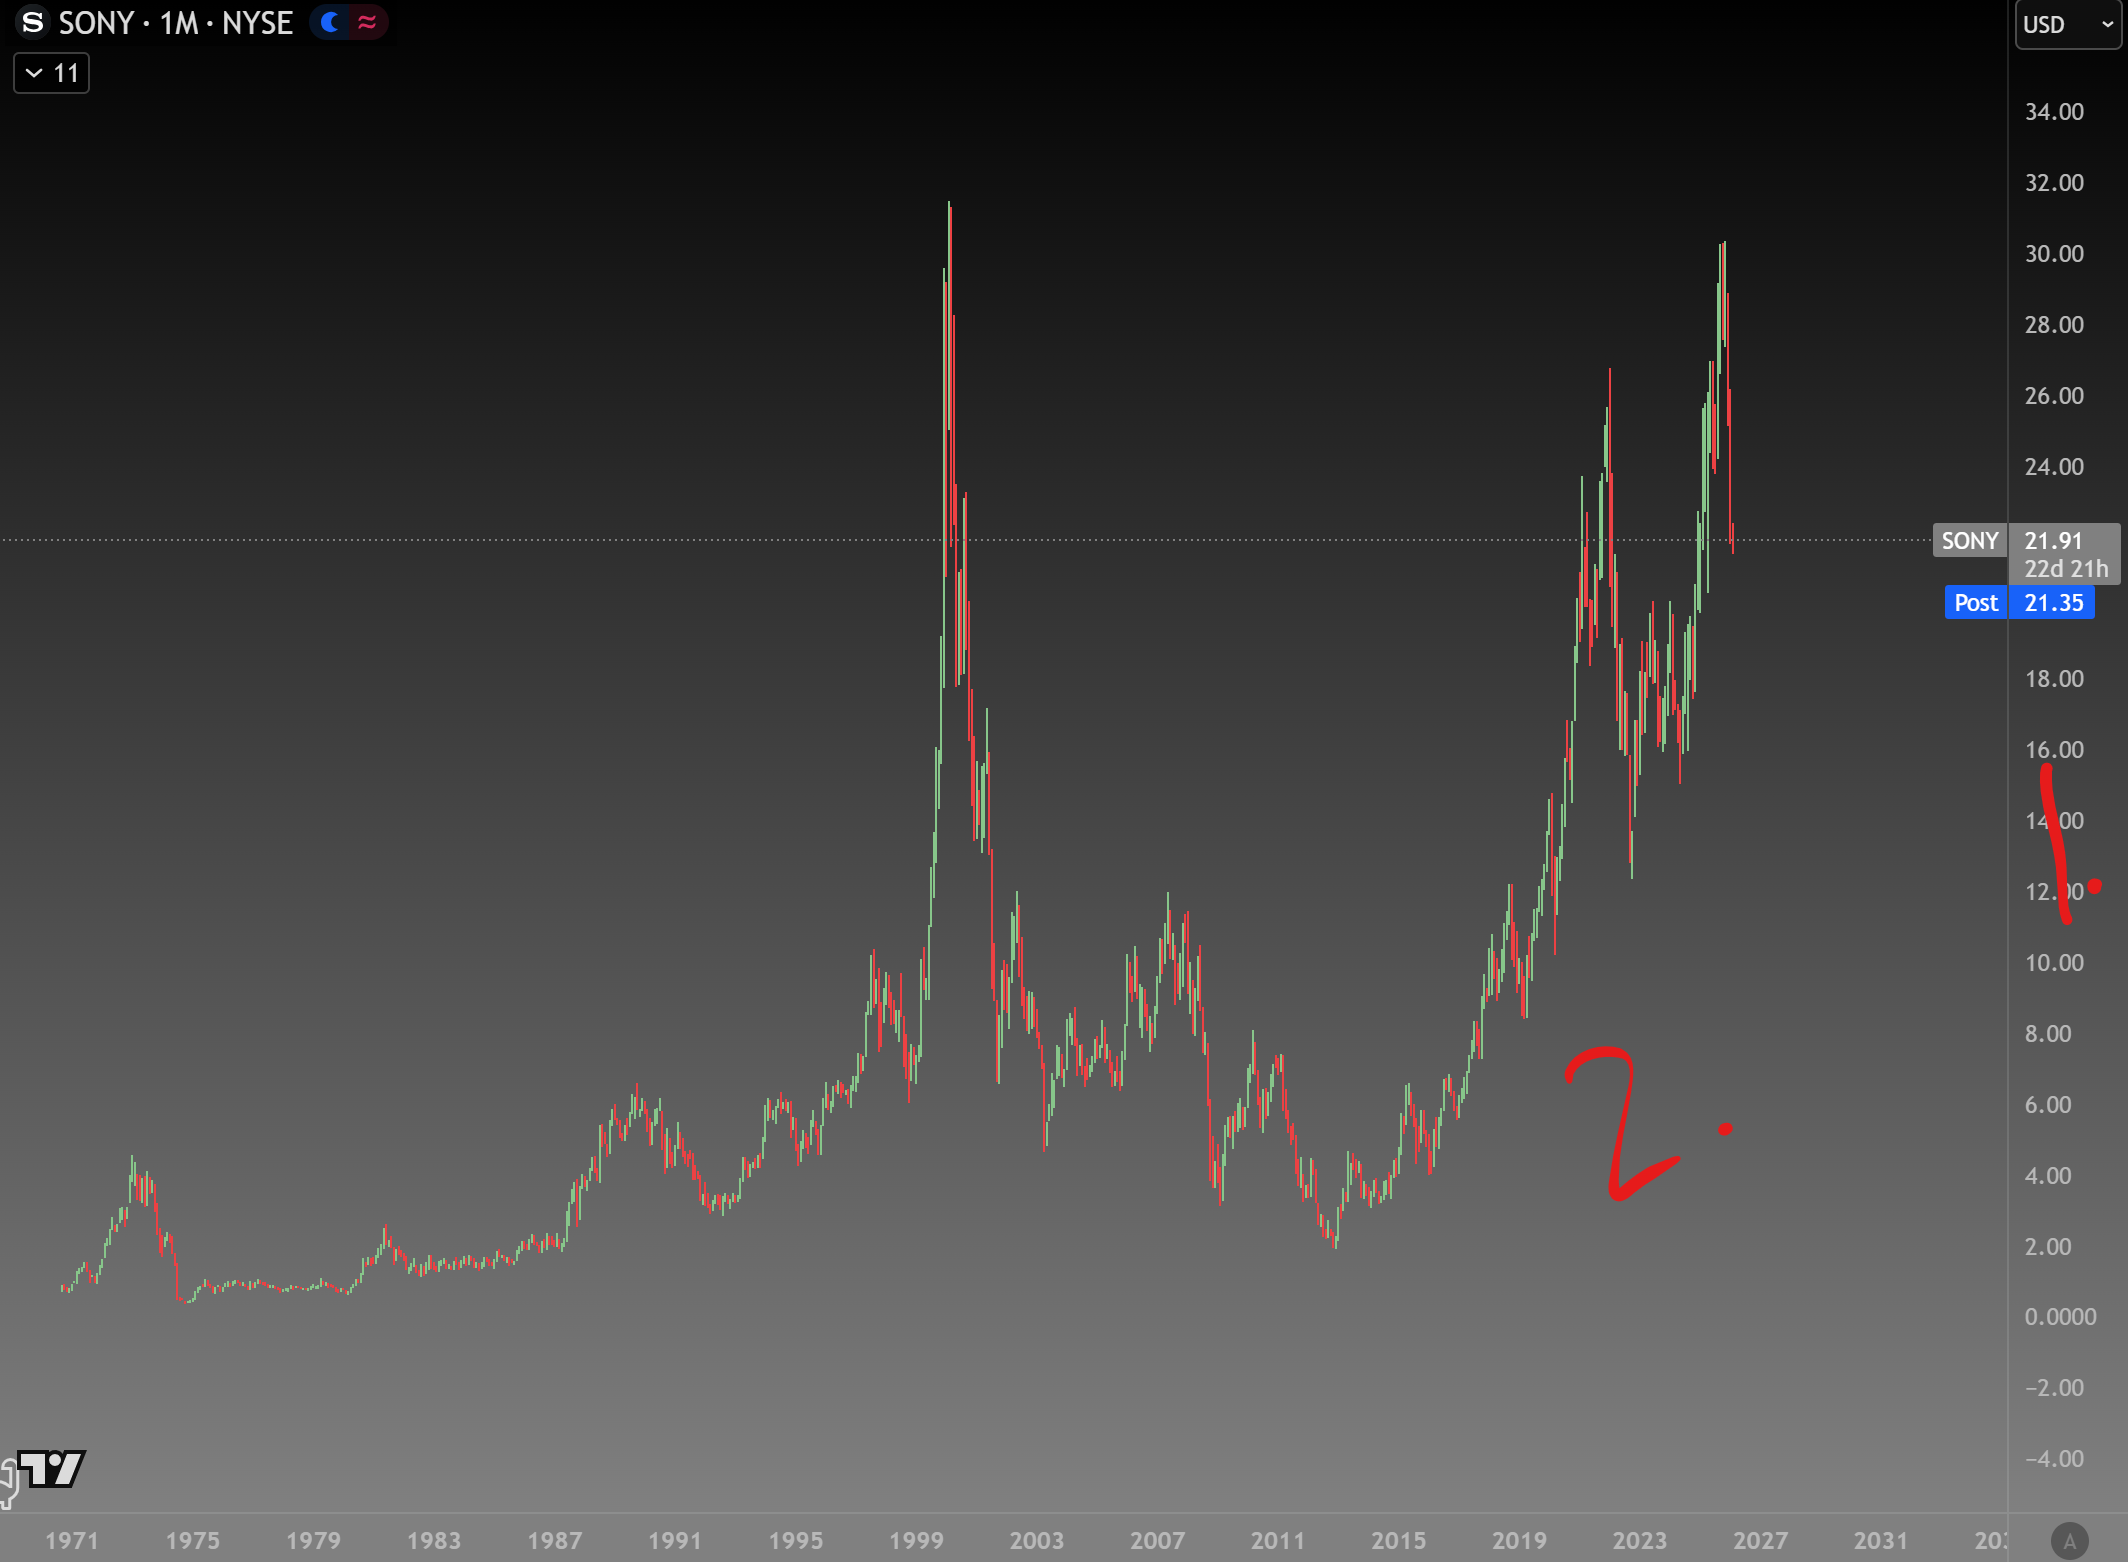
Chart Intro
To adjust the chart height, scroll up/down over the price gauge on the right side - 1.
To adjust the chart width, scroll up/down anywhere on the main screen of the chart - 2.
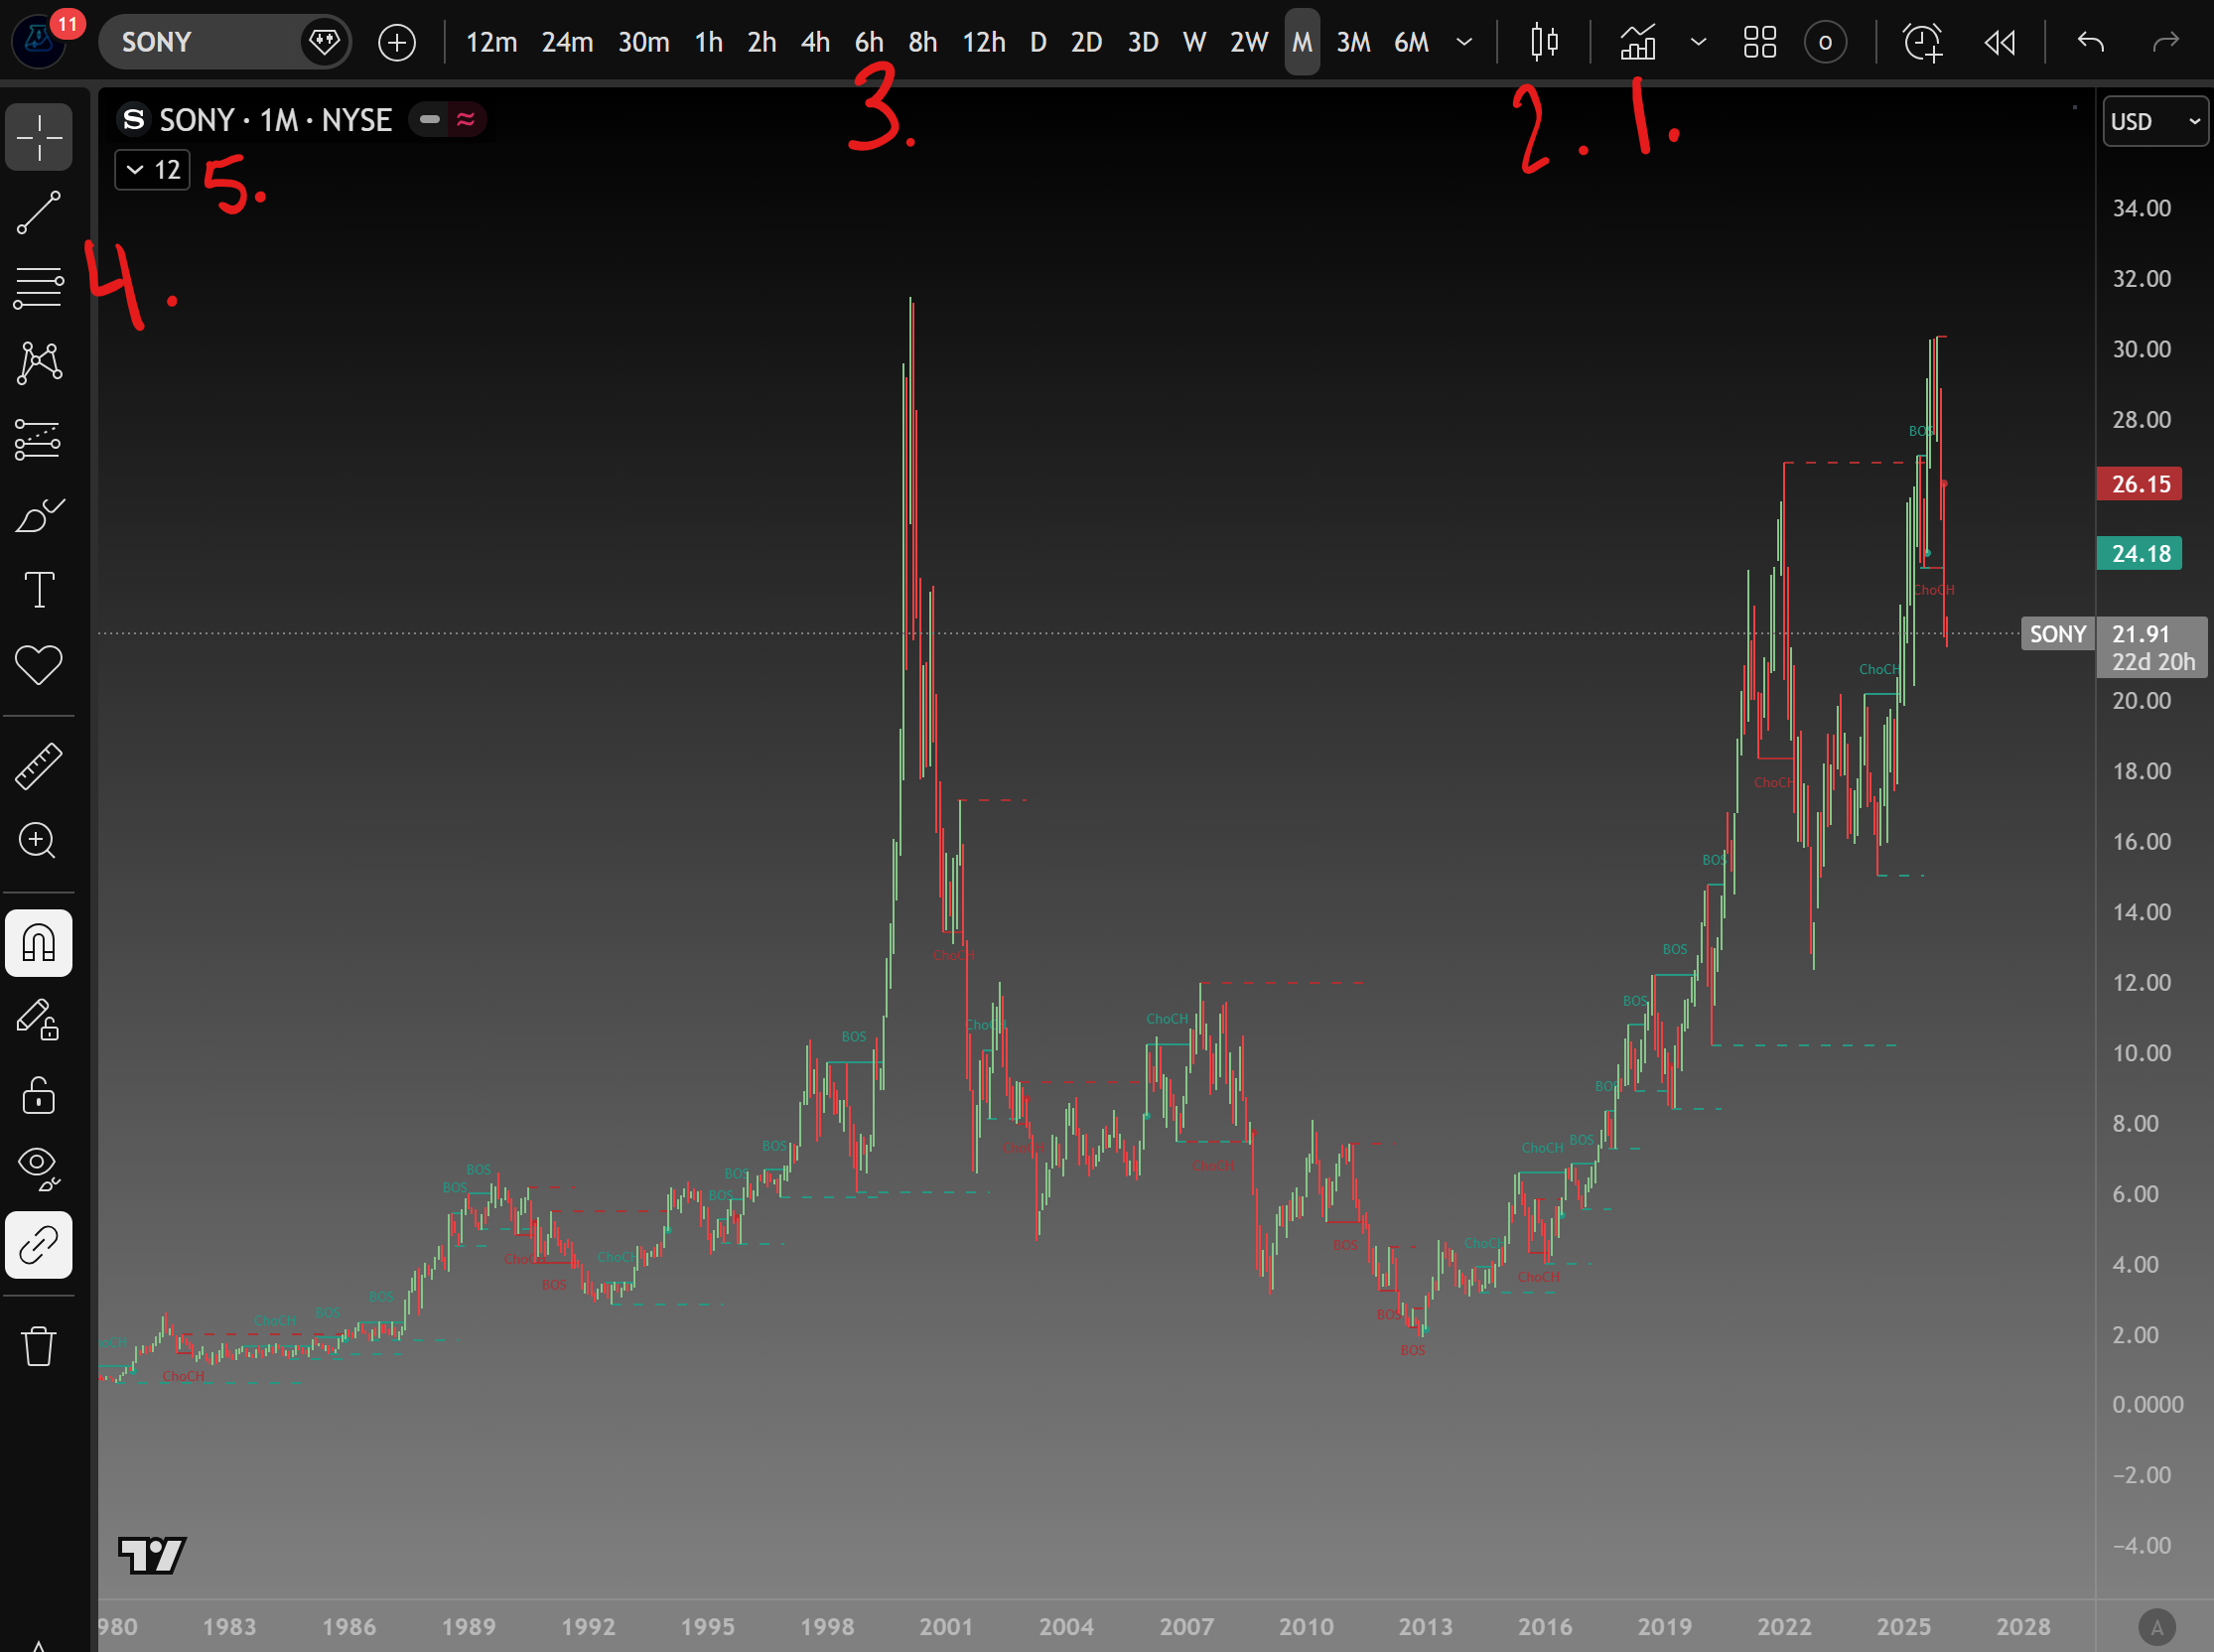
Chart Basics
To add indicators, click the indicator icon - 1.
To change the candle type, click the candle icon - 2.
To adjust the Time Frame, choose your desired time frame - 3.
To use tools such as rays, trendlines, Fibonacci Retracement, Parallells, etc click the icons on the left pane - 4.
To toggle selected indicators or remove indicators, click the number with a down arrow underneath the Ticker - 5.
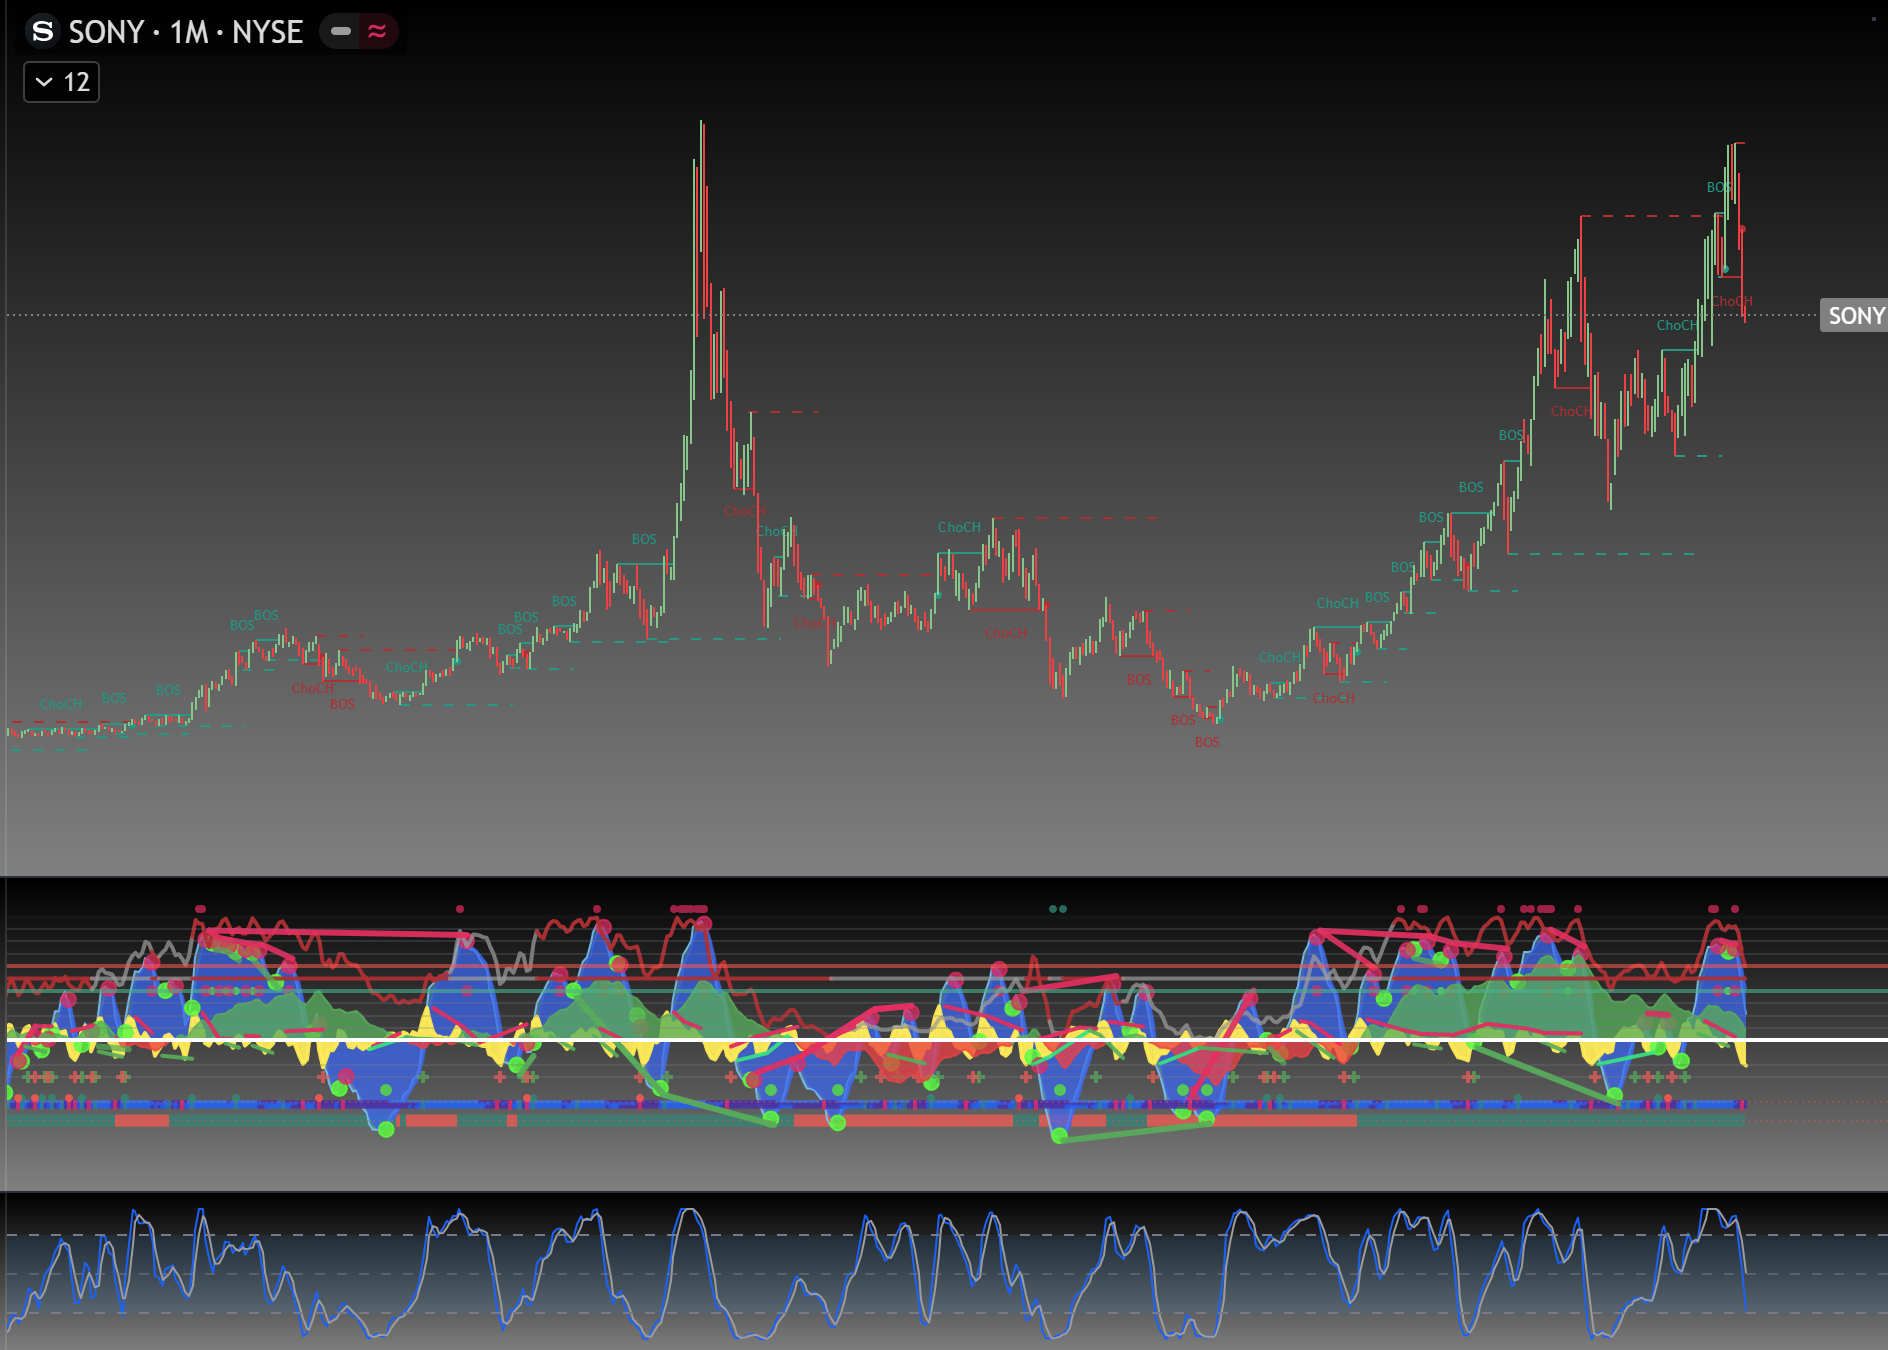
Chart - Full Screen
Double click anywhere on the main screen of the chart to enter the full screen version of the chart.
Double click anywhere on the main screen of the chart to exit full screen and show your selected indicators beneath.
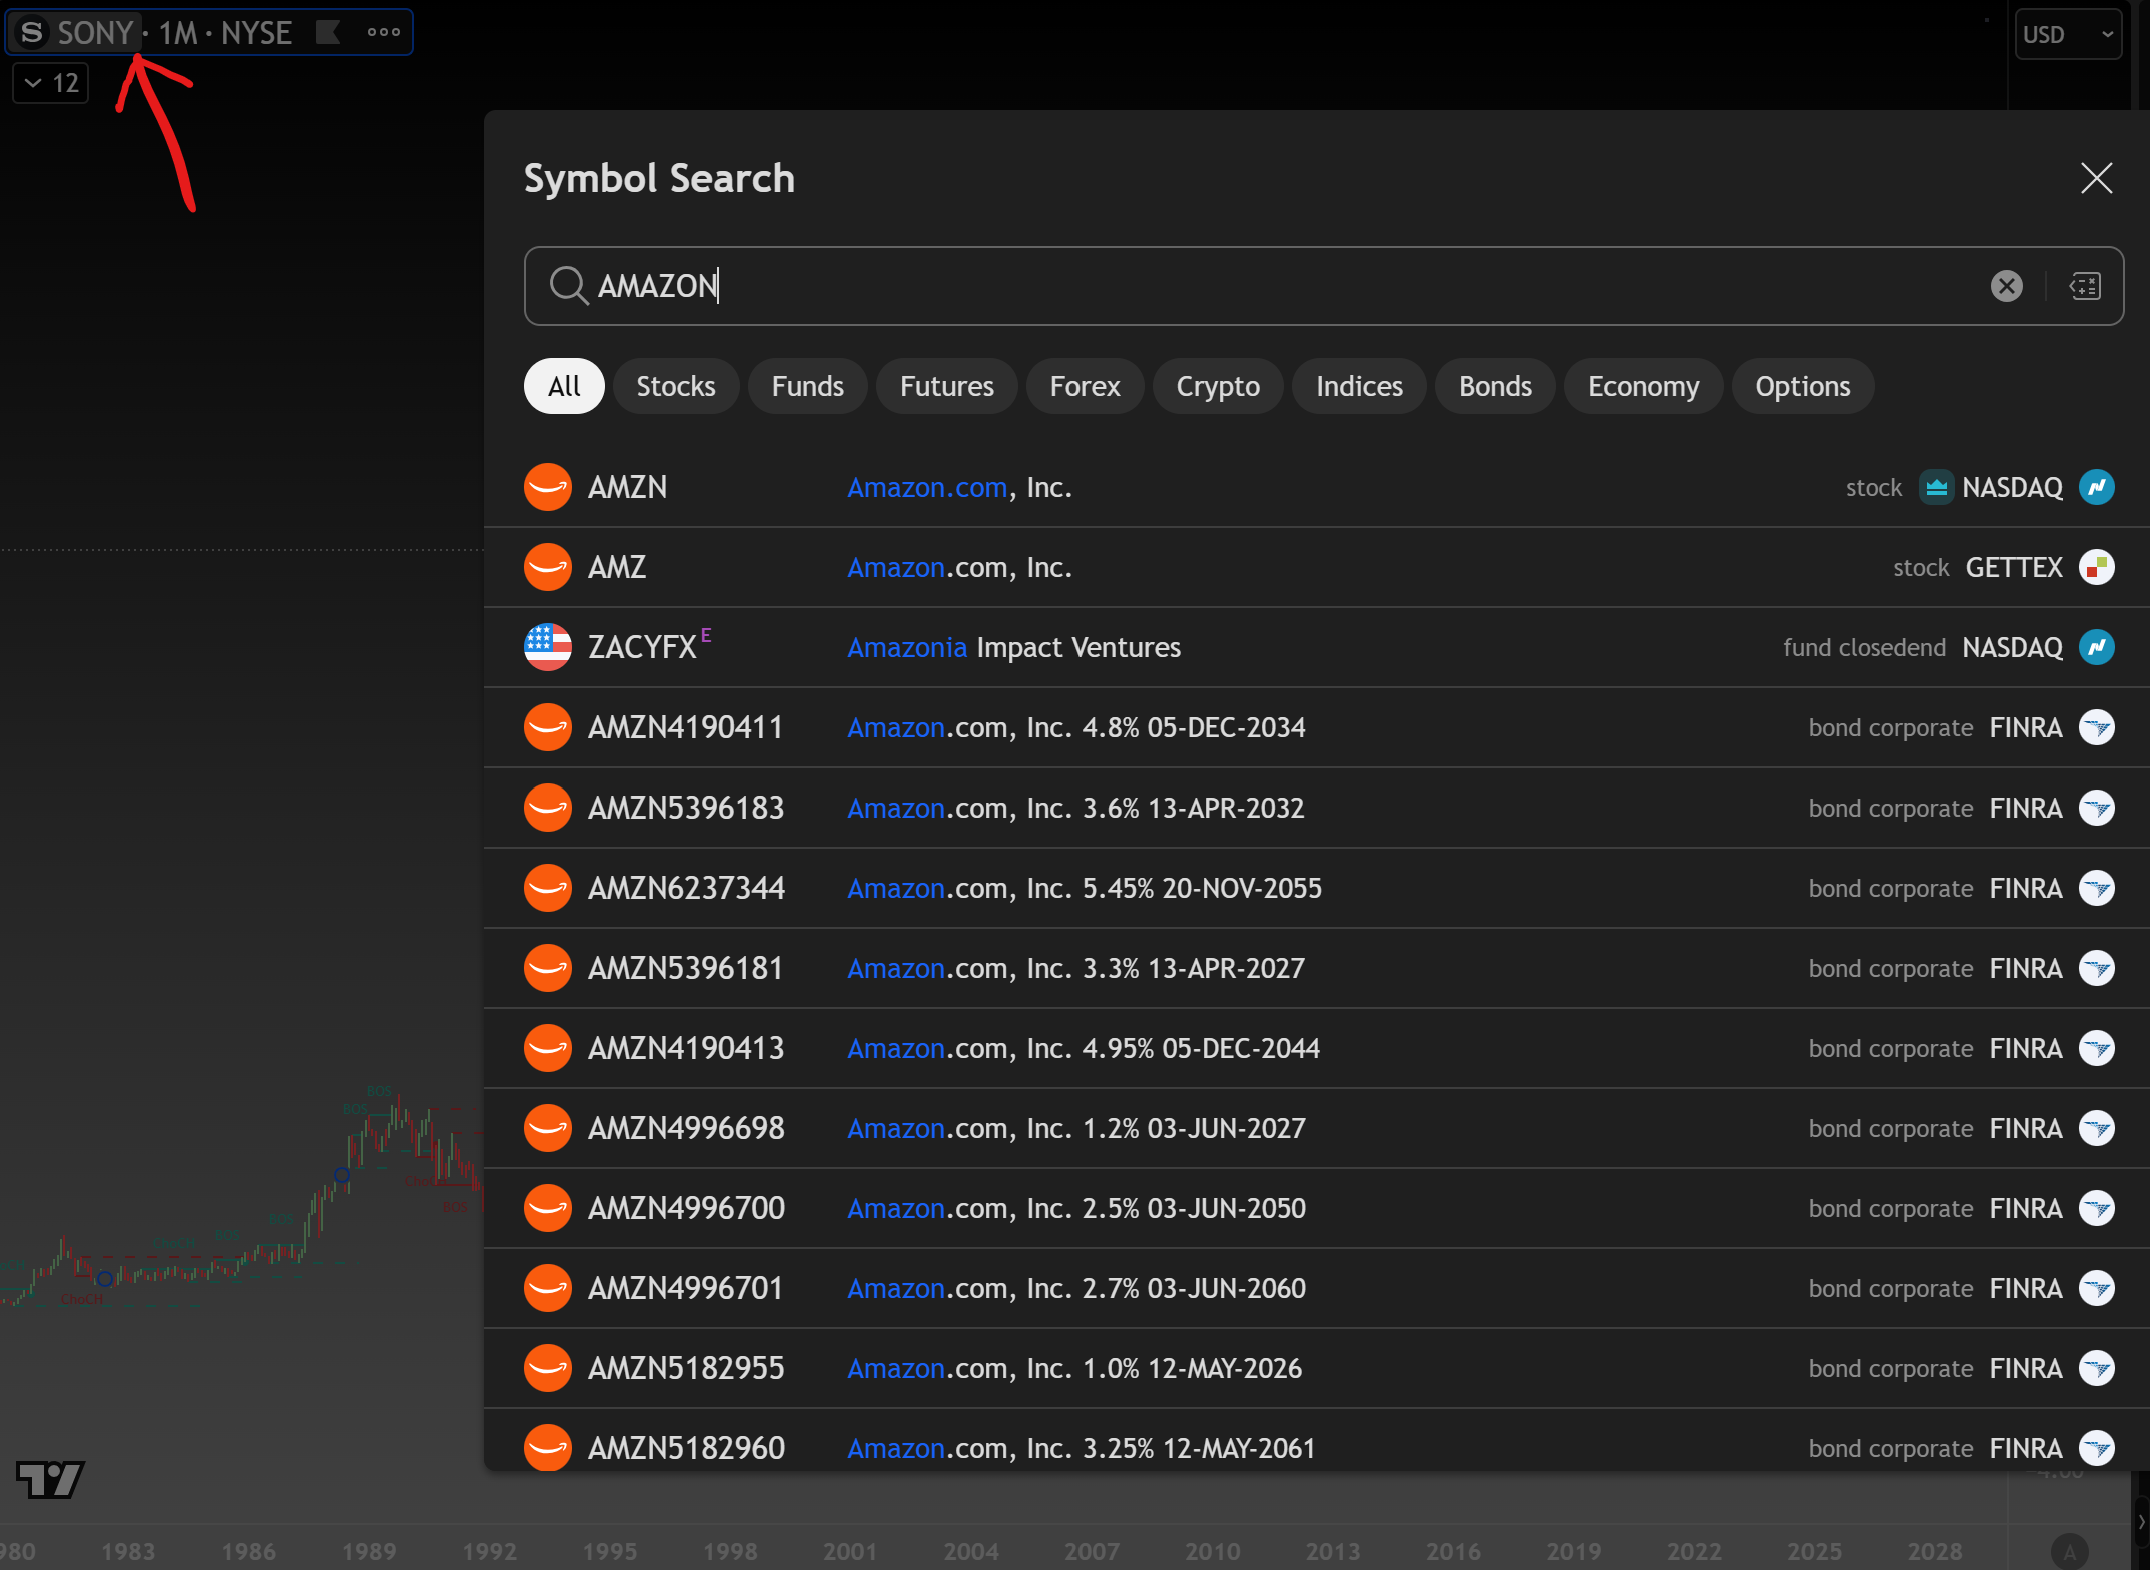
Chart - Changing the Asset
Click on the Ticker name to open a Search Window to change the asset you want to chart on your screen.
Choose the Ticker with the correct Exchange, in this example it is AMZN listed on the Nasdaq.

Sign Up for more!
Ready to advance your knowledge?
We specialize in breaking things down in an easy to digest fashion for all.