
Invite-Only indicators
members are granted access to our list of invite-only indicators on tradingView

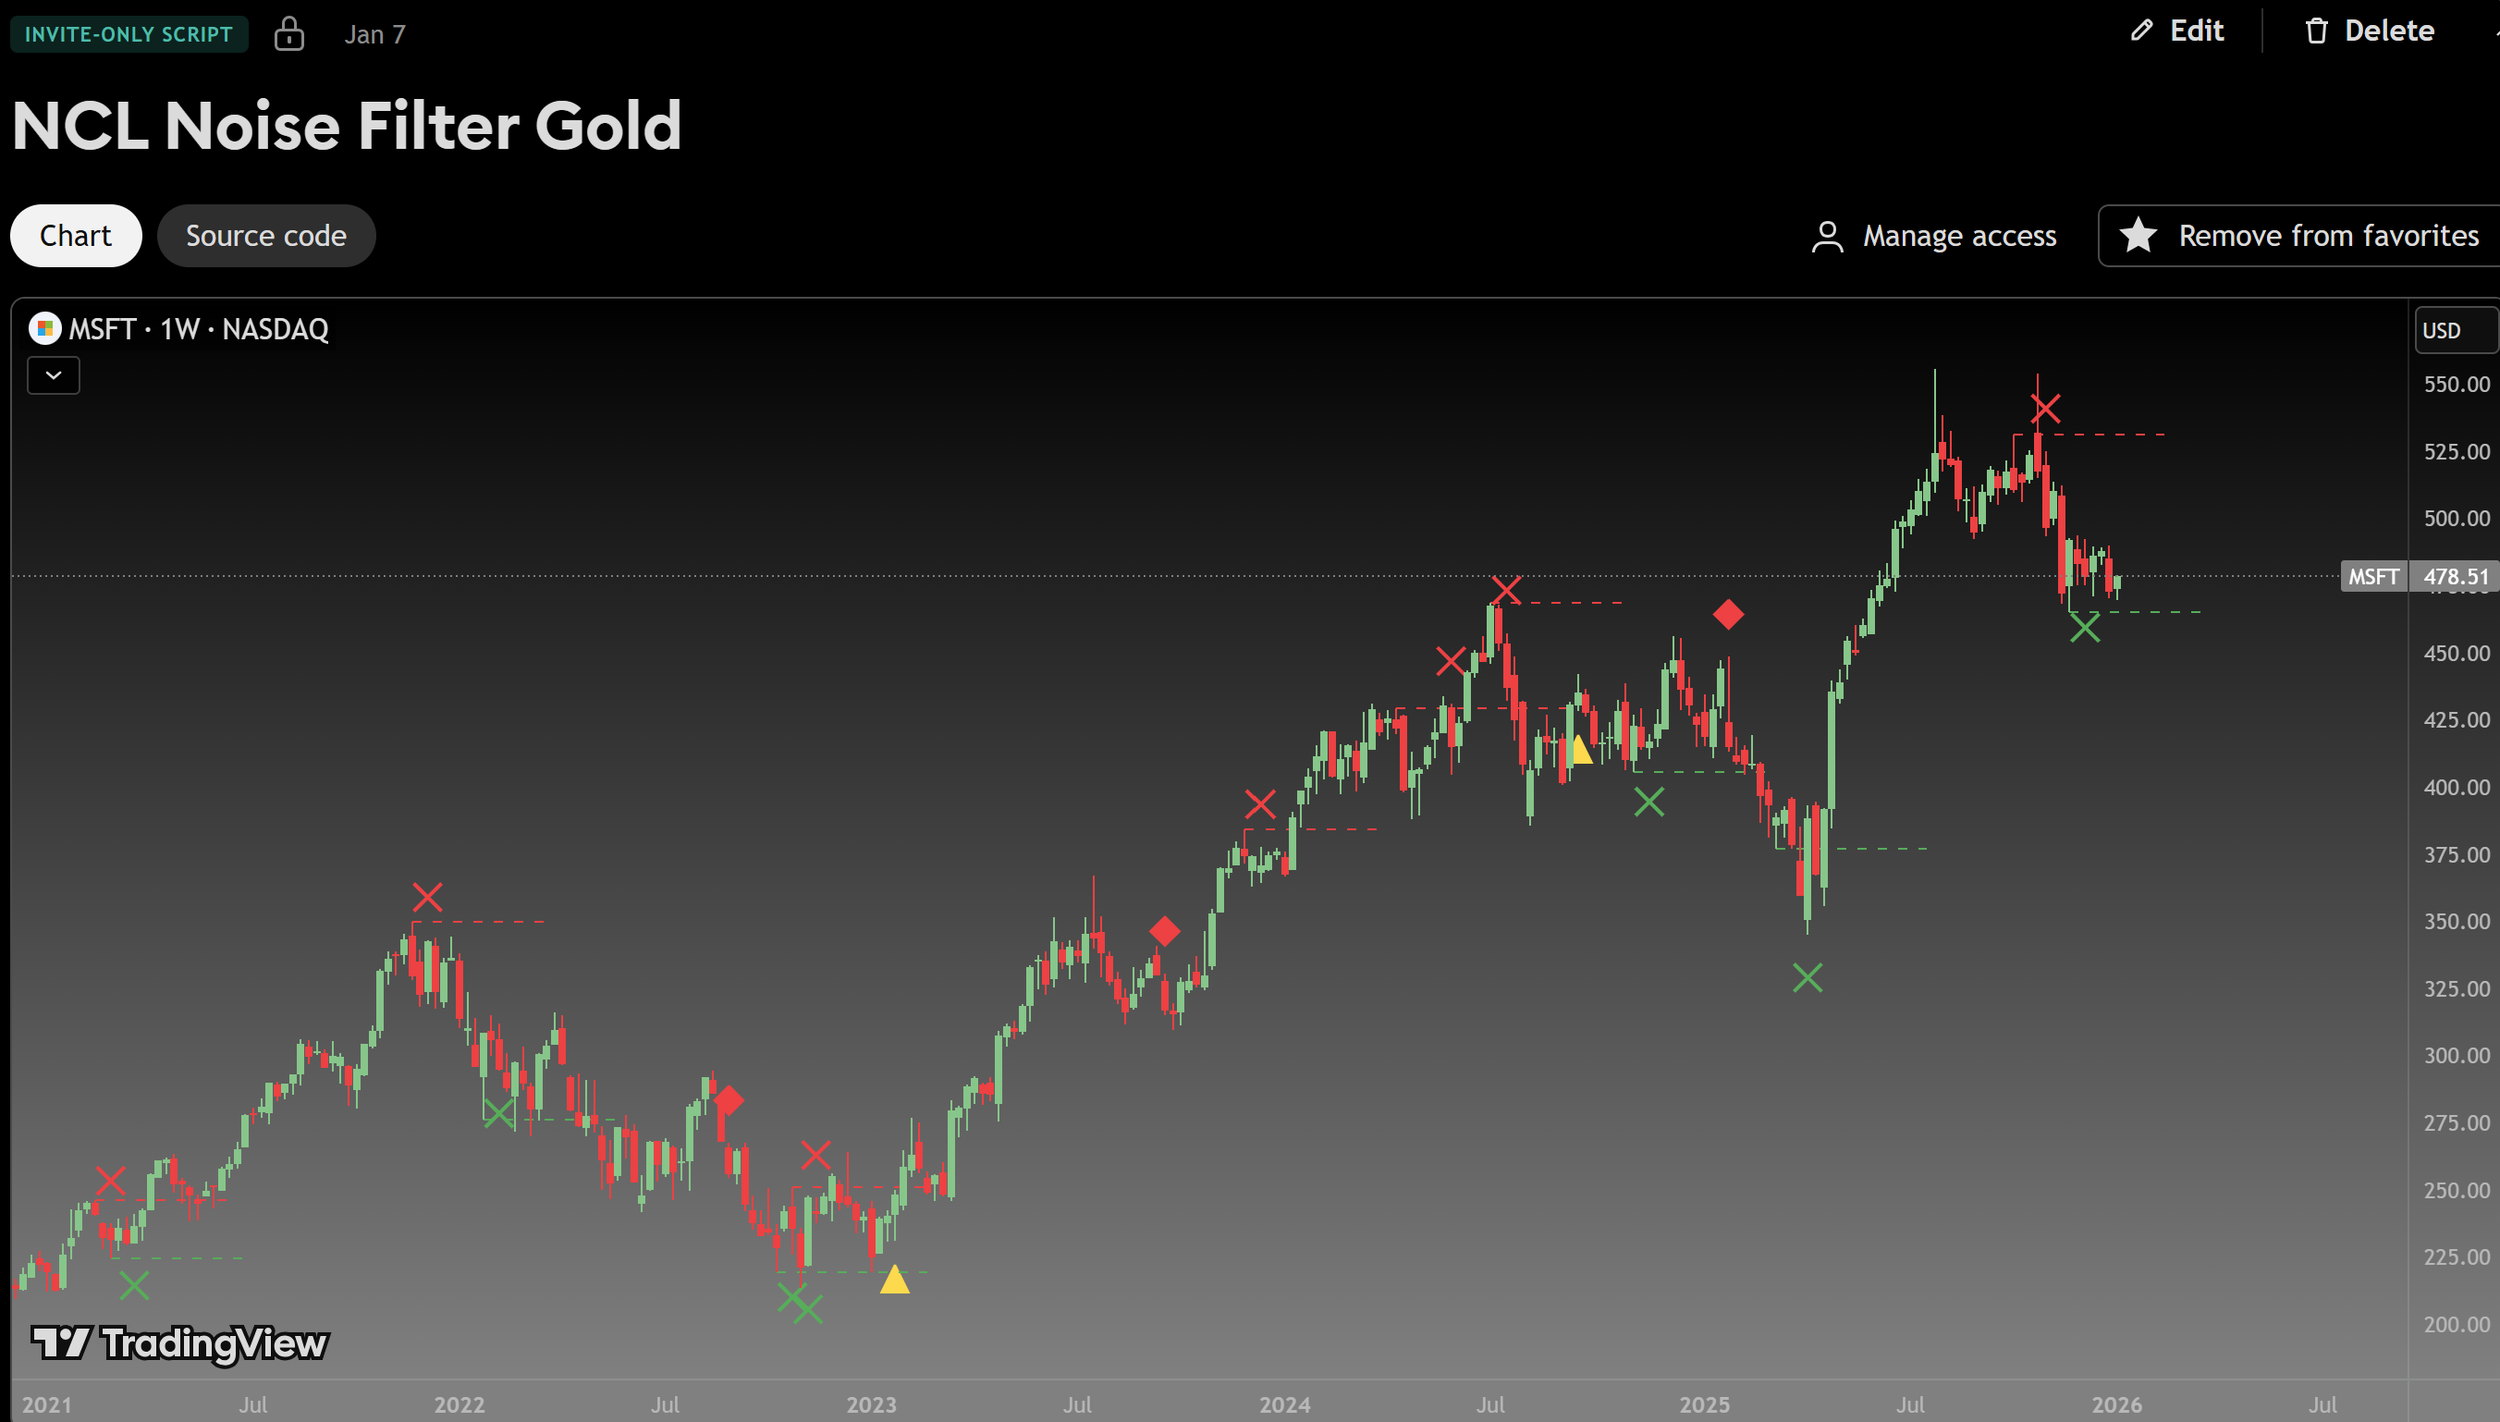
NCL Noise Filter Gold
Volume Filter: The volume filter automatically turns OFF when you switch to Major Macro Cycle or Institutional Baseline, as those high-timeframe structural breaks are often valid even on lower relative volume.
You can change the volume requirement by checking the volume of the current breakout bar against its Relative Volume (RVOL) - A setting of 0 turns this OFF.
A common professional standard is to require the breakout volume to be at least 1.5x to 2x higher than the 20-period average volume.
*we recommend using a higher volume setting on low timeframes under the 4HR to reduce false signals.
Our Signature Indicator - the NCL Noise Filter.
FILTER OUT THE NOISE and focus only on the moves that matter, toggle the settings to add or decrease the amount of signals given on the chart.
The Noise Filter detects high-probability swing setups by using price action & volume over a chosen duration of time.
First choose which type of trade you are looking to enter:
Duration Table for 1Week Charts
Trading Style Fractal Length (p) Pattern Span Confirmation Delay
Standard Swing 2 5 Weeks 2 Weeks
Intermediate Trend 5 11 Weeks 5 Weeks
Major Macro Cycle 10–20 21–41 Weeks 10–20 Weeks
Institutional Baseline 44 ~2 Years ~10 Months
Or switch the Duration Setting to Institutional on a high timeframe (1W+) to locate great spot buying opportunities near cycle tops and bottoms.
Legend
Red X: 5/11 MA Cross
Green X: 5/11 MA Cross
Blood Diamond: Cross + Momentum
Golden Triangle: Cross + Momentum
ATR Filter:
Filters "Fake-Outs": It forces the price to not just "touch" the trendline, but to break it with enough force to clear the current average volatility.
Adaptive: Unlike a fixed pip/dollar amount, the ATR adjusts to the asset. On Bitcoin, the threshold might be $500; on a penny stock, it might be $0.05.
Bullish Cross: The price must close above the support trendline + (0.5 * ATR).
Bearish Cross: The price must close below the resistance trendline - (0.5 * ATR).
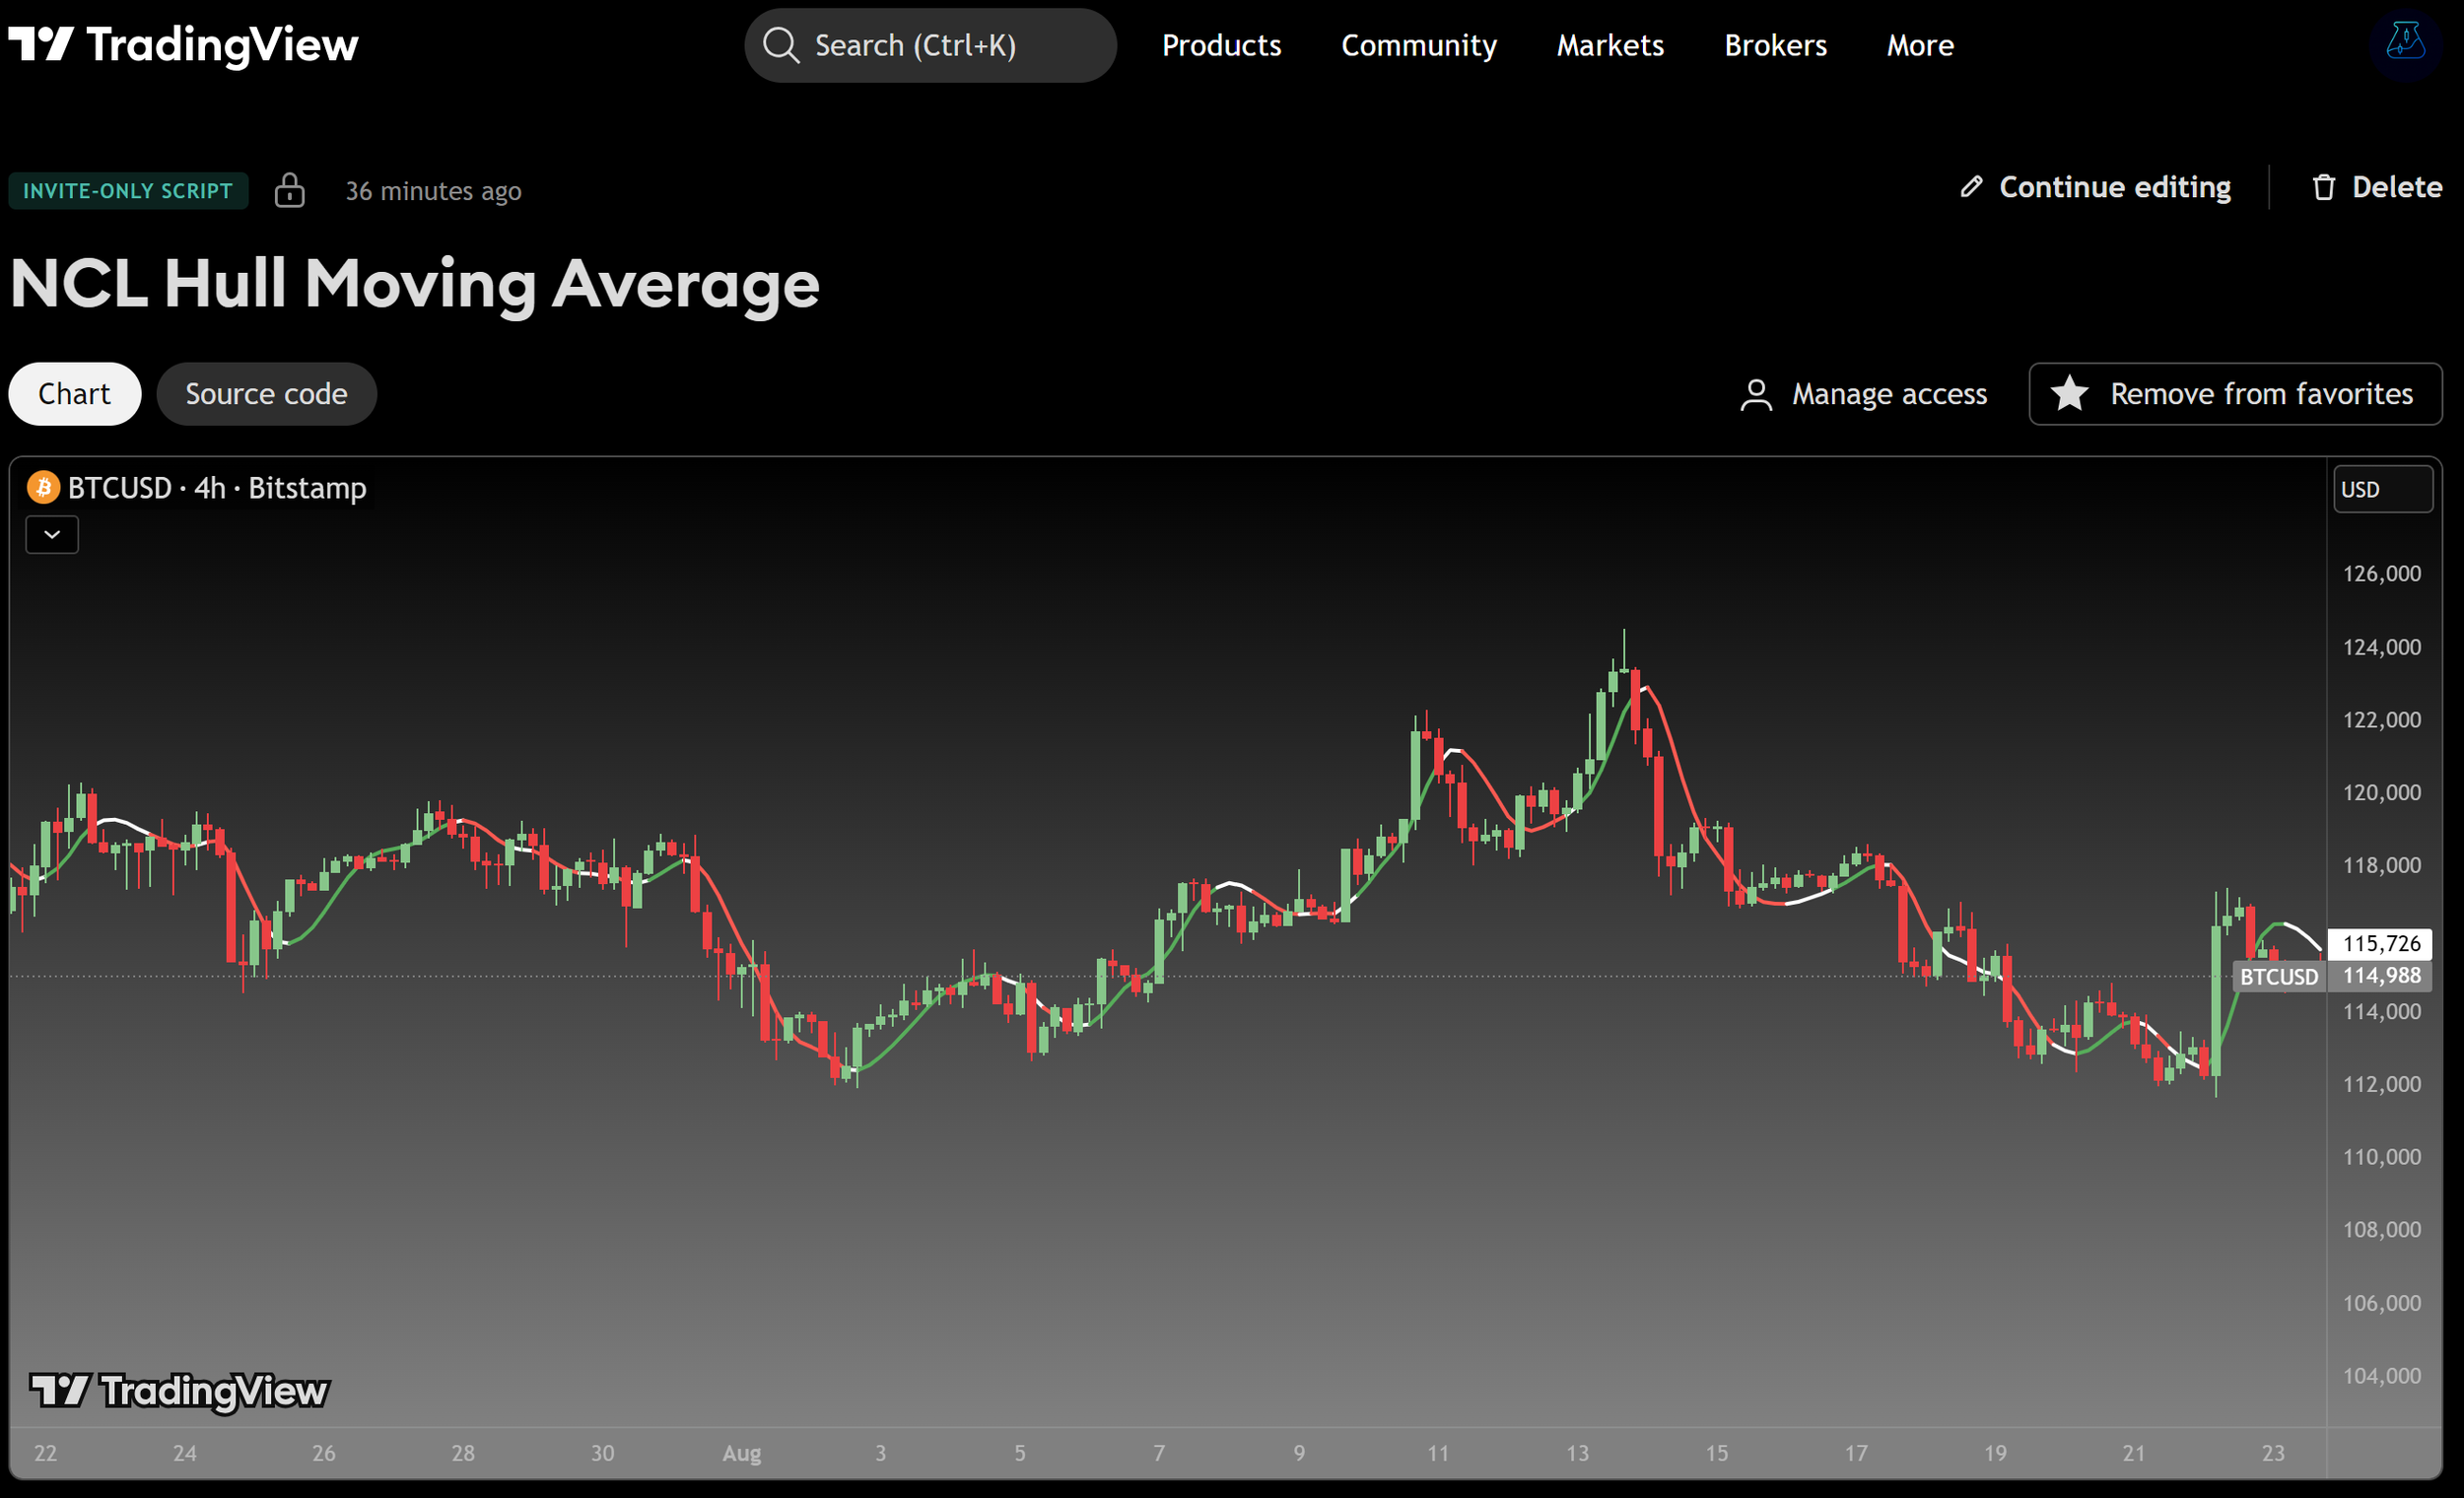
NCL Hull Moving Average
One of our Favorite Indicators - The NeoChart Labs Hull Moving Average
Shout out to r0m3 for creating the original Hull Momentum
This indicator changes green when the Stochastic RSI moves into Bullish territory , white when Neutral, and red when Bearish.
Smoothed out and sped up to be more compatible with the fast paced Crypto market.
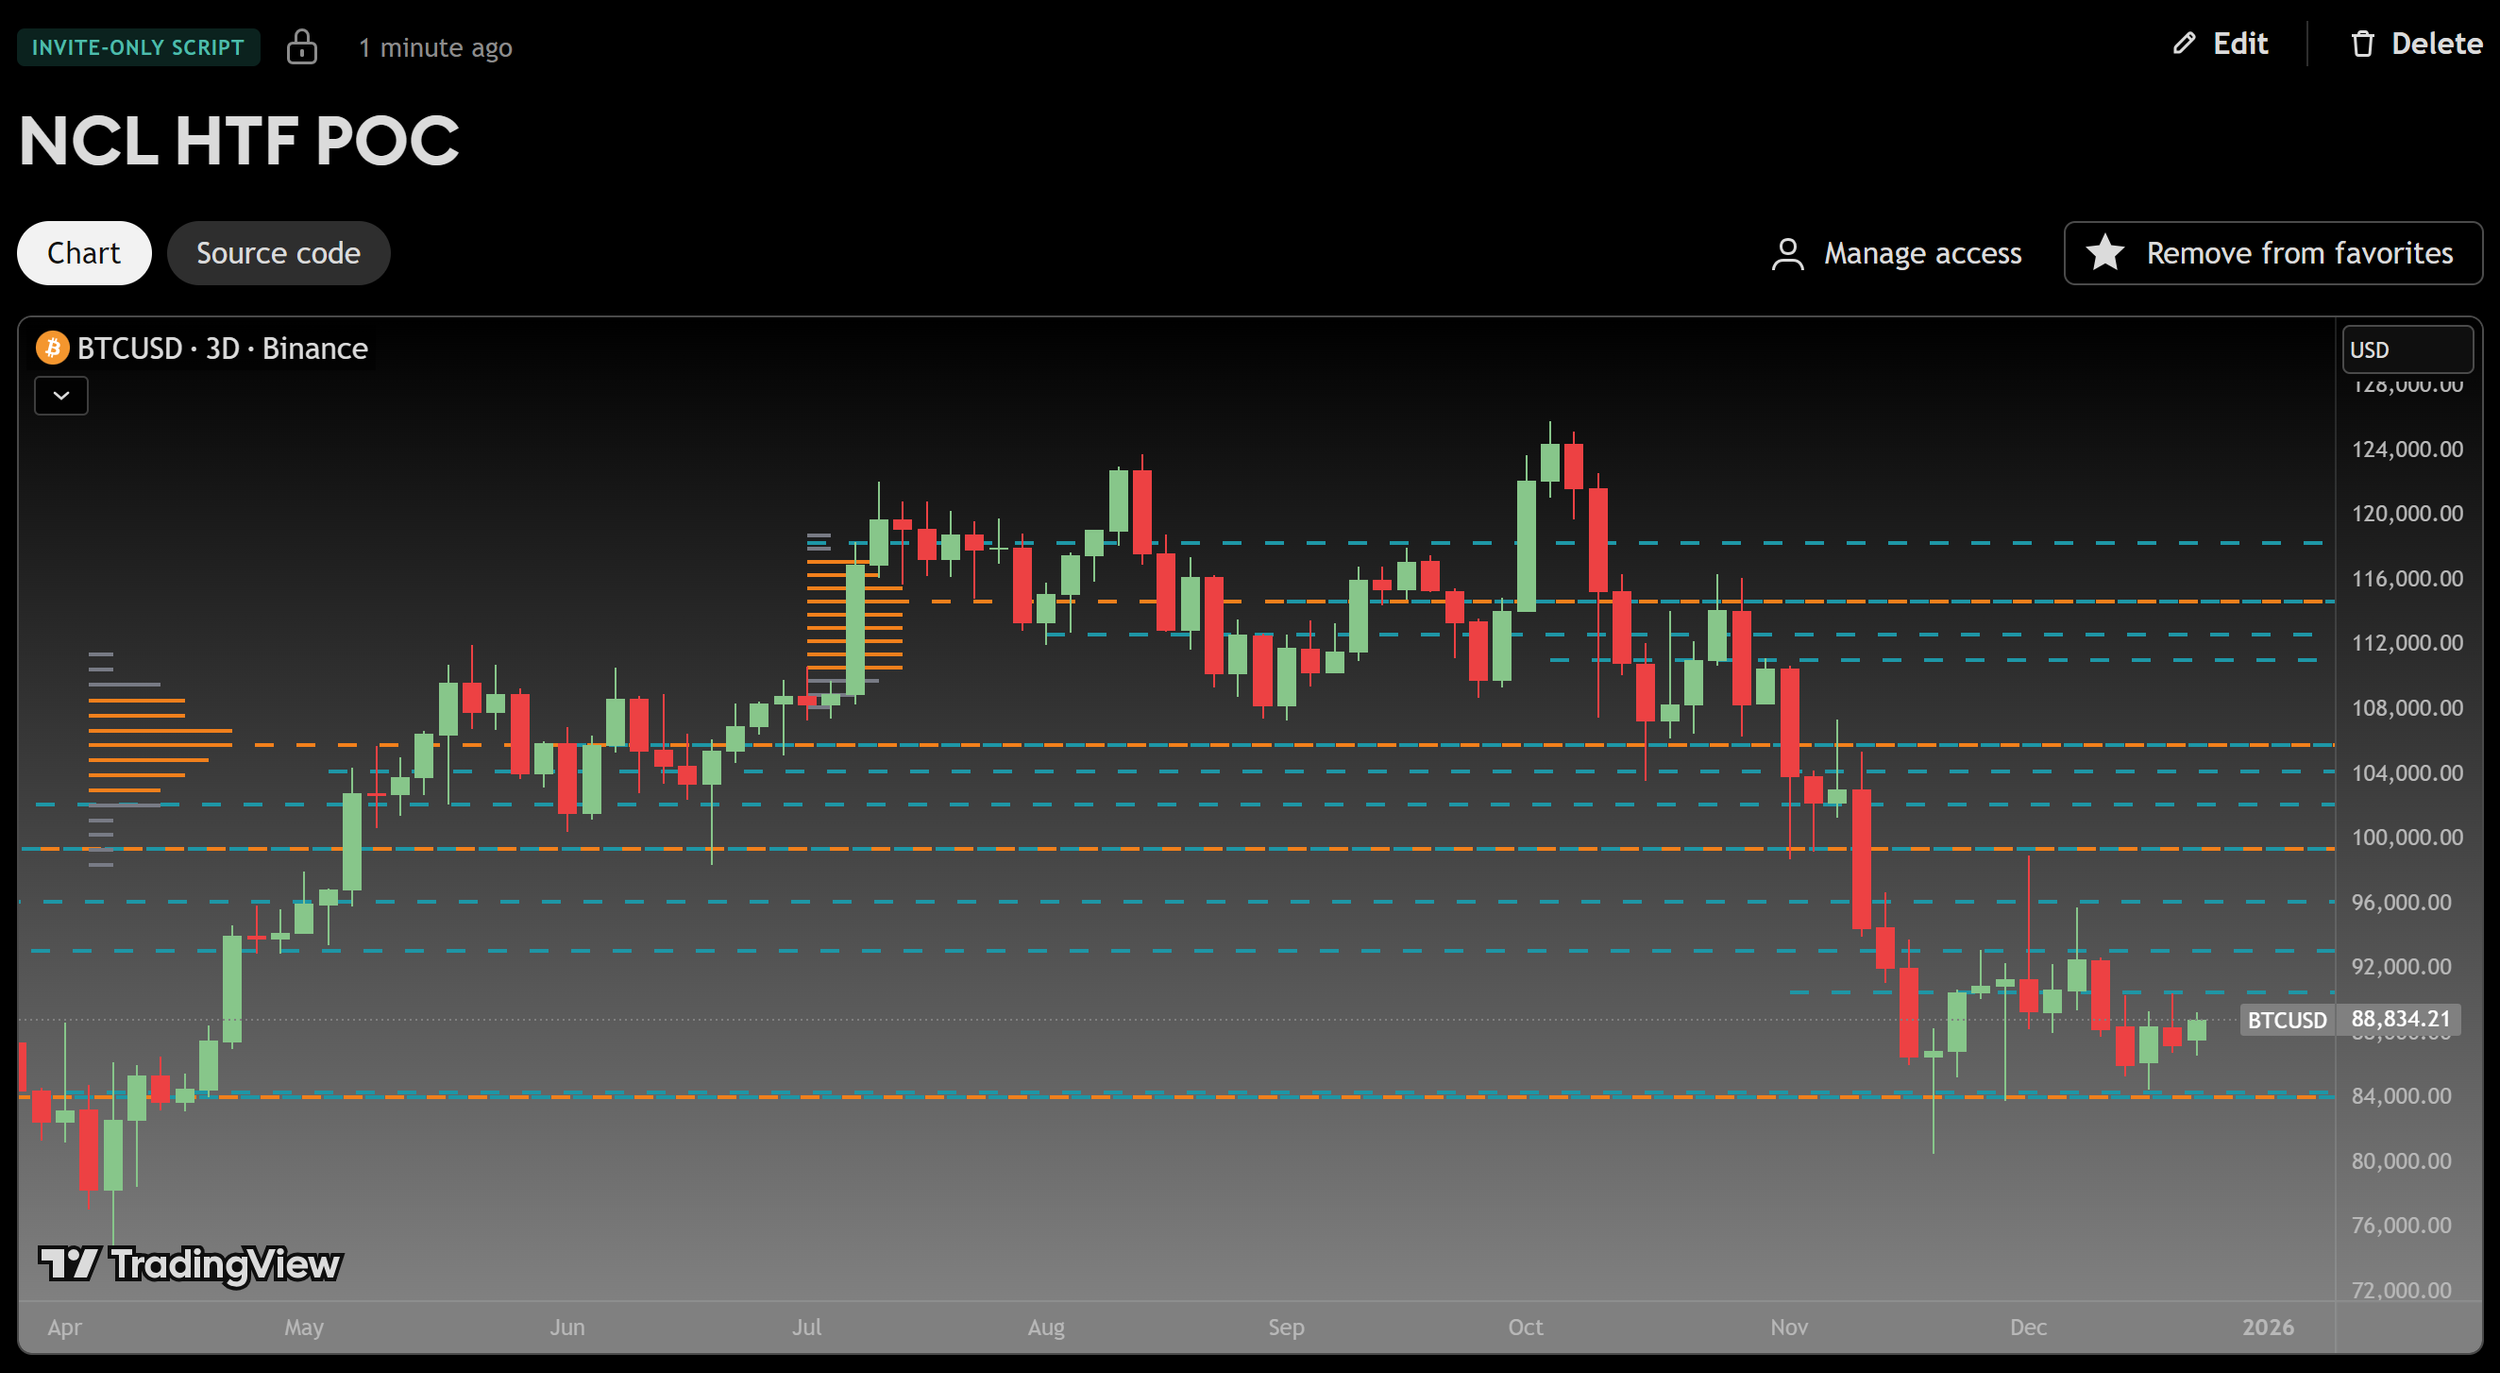
NCL HTF POC
One of our Favorite Indicators - the High Time Frame Point of Control with a Volume Profile.
Shout out to p2pasta for the original script, we updated to v6.
Currently included: Monthly, 3 months and 6 months.
/* DEFINITION */
Point Of Control (= POC) is a price level at which the heaviest volumes were traded.
Value Area High/Low (=VAH/VAL) is a range of prices where the majority of trading volume took place. Naturally, Value Area High being the top price level and Value Area Low being the lowest. POC always is between the two.
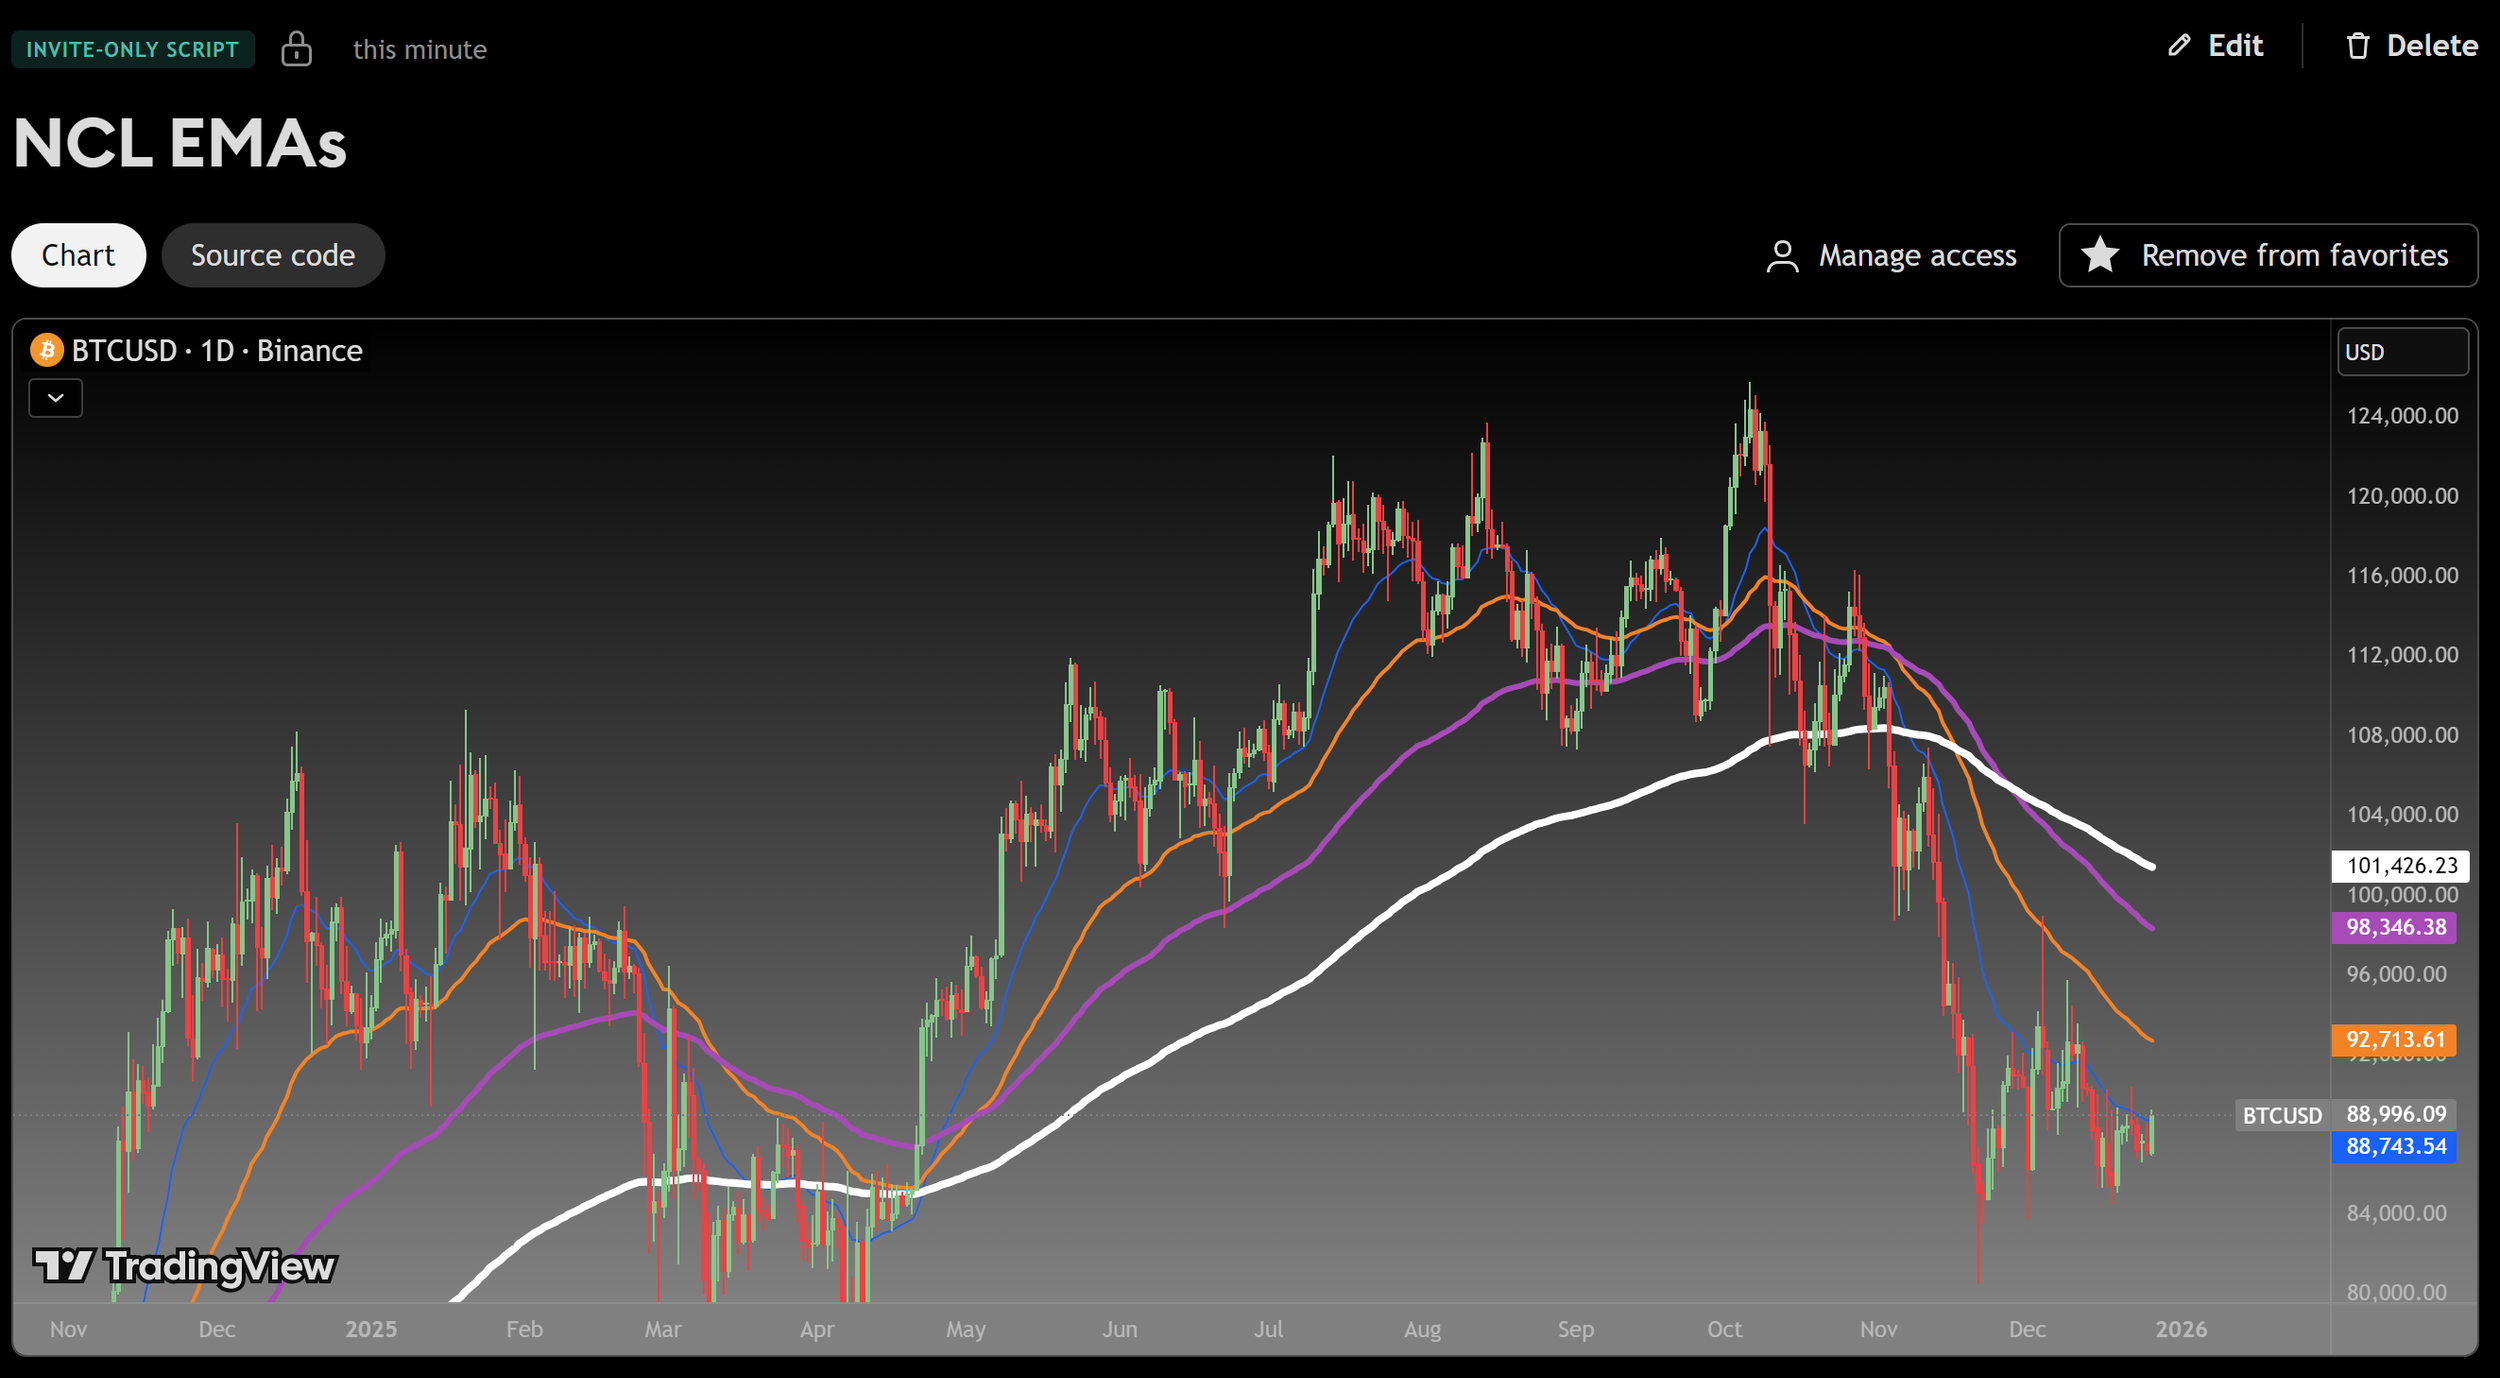
NCL EMA’s
One of our Favorite Indicators - the NeoChart Labs 20/50/100/200 EMAs
20 = Blue and very thin
50 = Orange and thin
100 = Purple and thick
200 = White and very thick
When 20 Crosses above and below any other expect action.
50 crossing 200 on the 1D is the death cross.
Shout out to drsweets for the original script
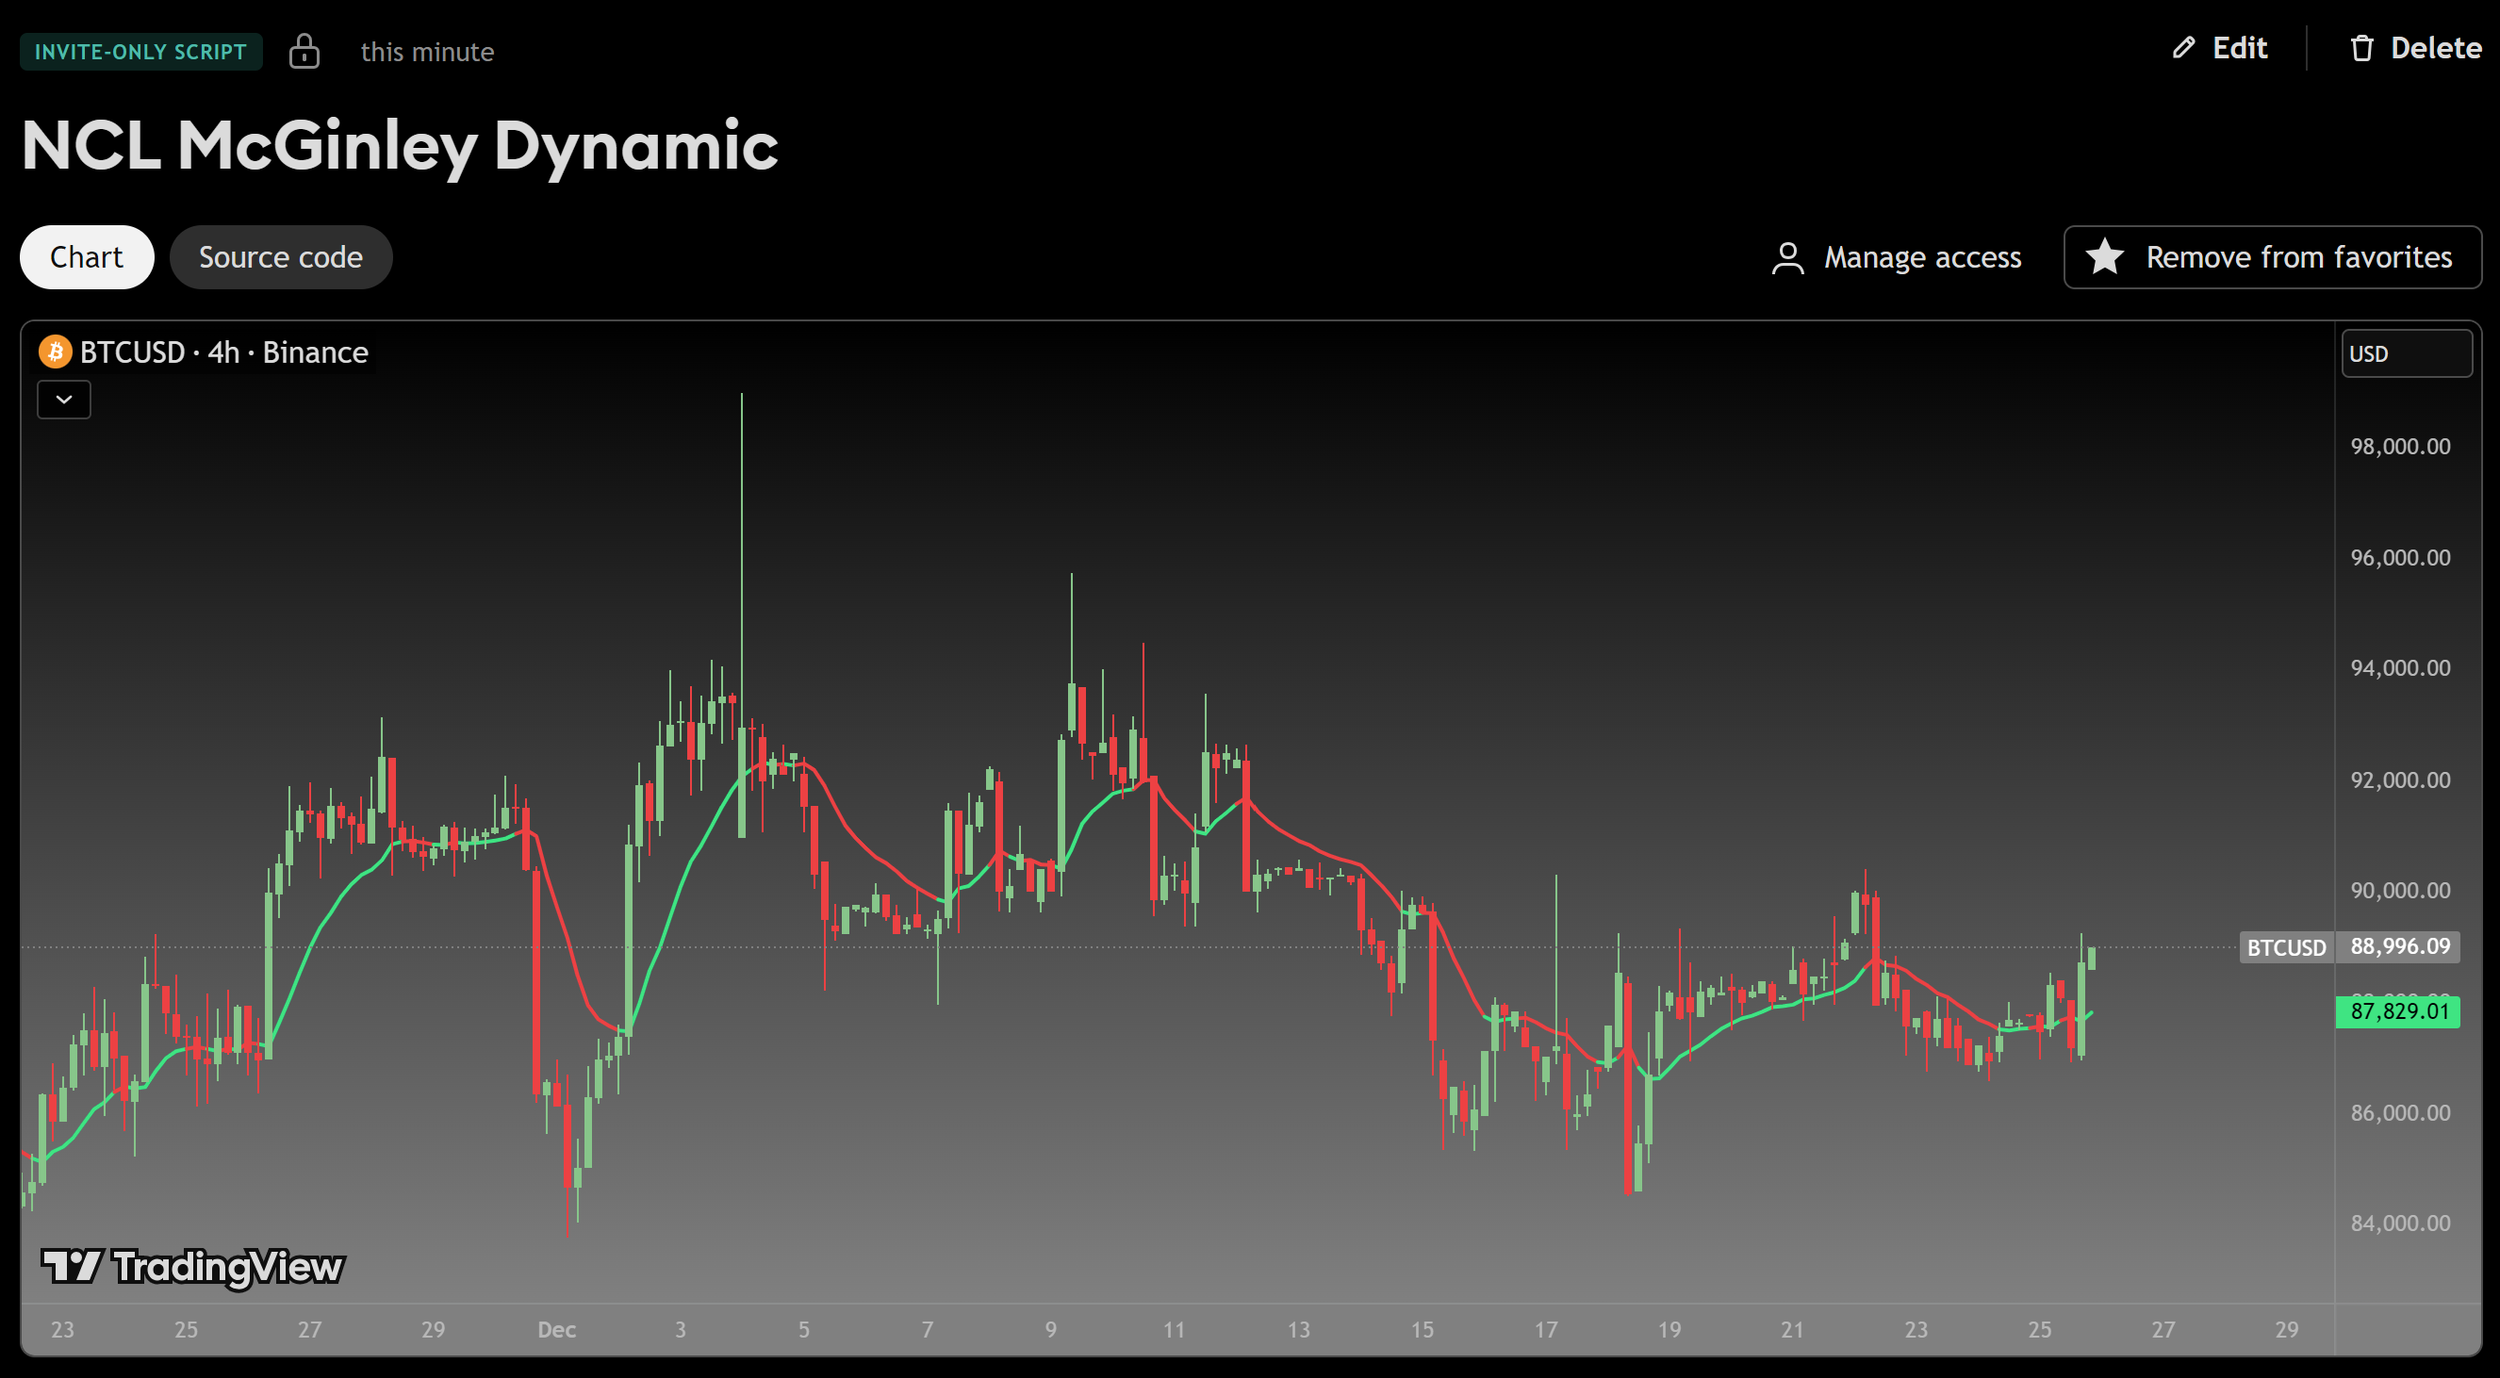
NCL McGinley Dynamic
One of our Favorite Indicators - the McGinley Dynamic
The MGD is adaptive, it speeds up for crypto and slows down for stocks, this version turns green when bullish and red when bearish - this is a fast indicator so the colors are more reliable on higher time frames.
The McGinley Dynamic is a smart, adaptive moving average technical indicator created by John R. McGinley, designed to overcome the lag and whipsaw issues of traditional moving averages (MAs) by automatically adjusting to varying market speeds, resulting in a smoother, more responsive line that tracks price action better, acting as a reliable trend-following tool or baseline in financial charts.
Shout out to LOXX for the original script, updated to v6.
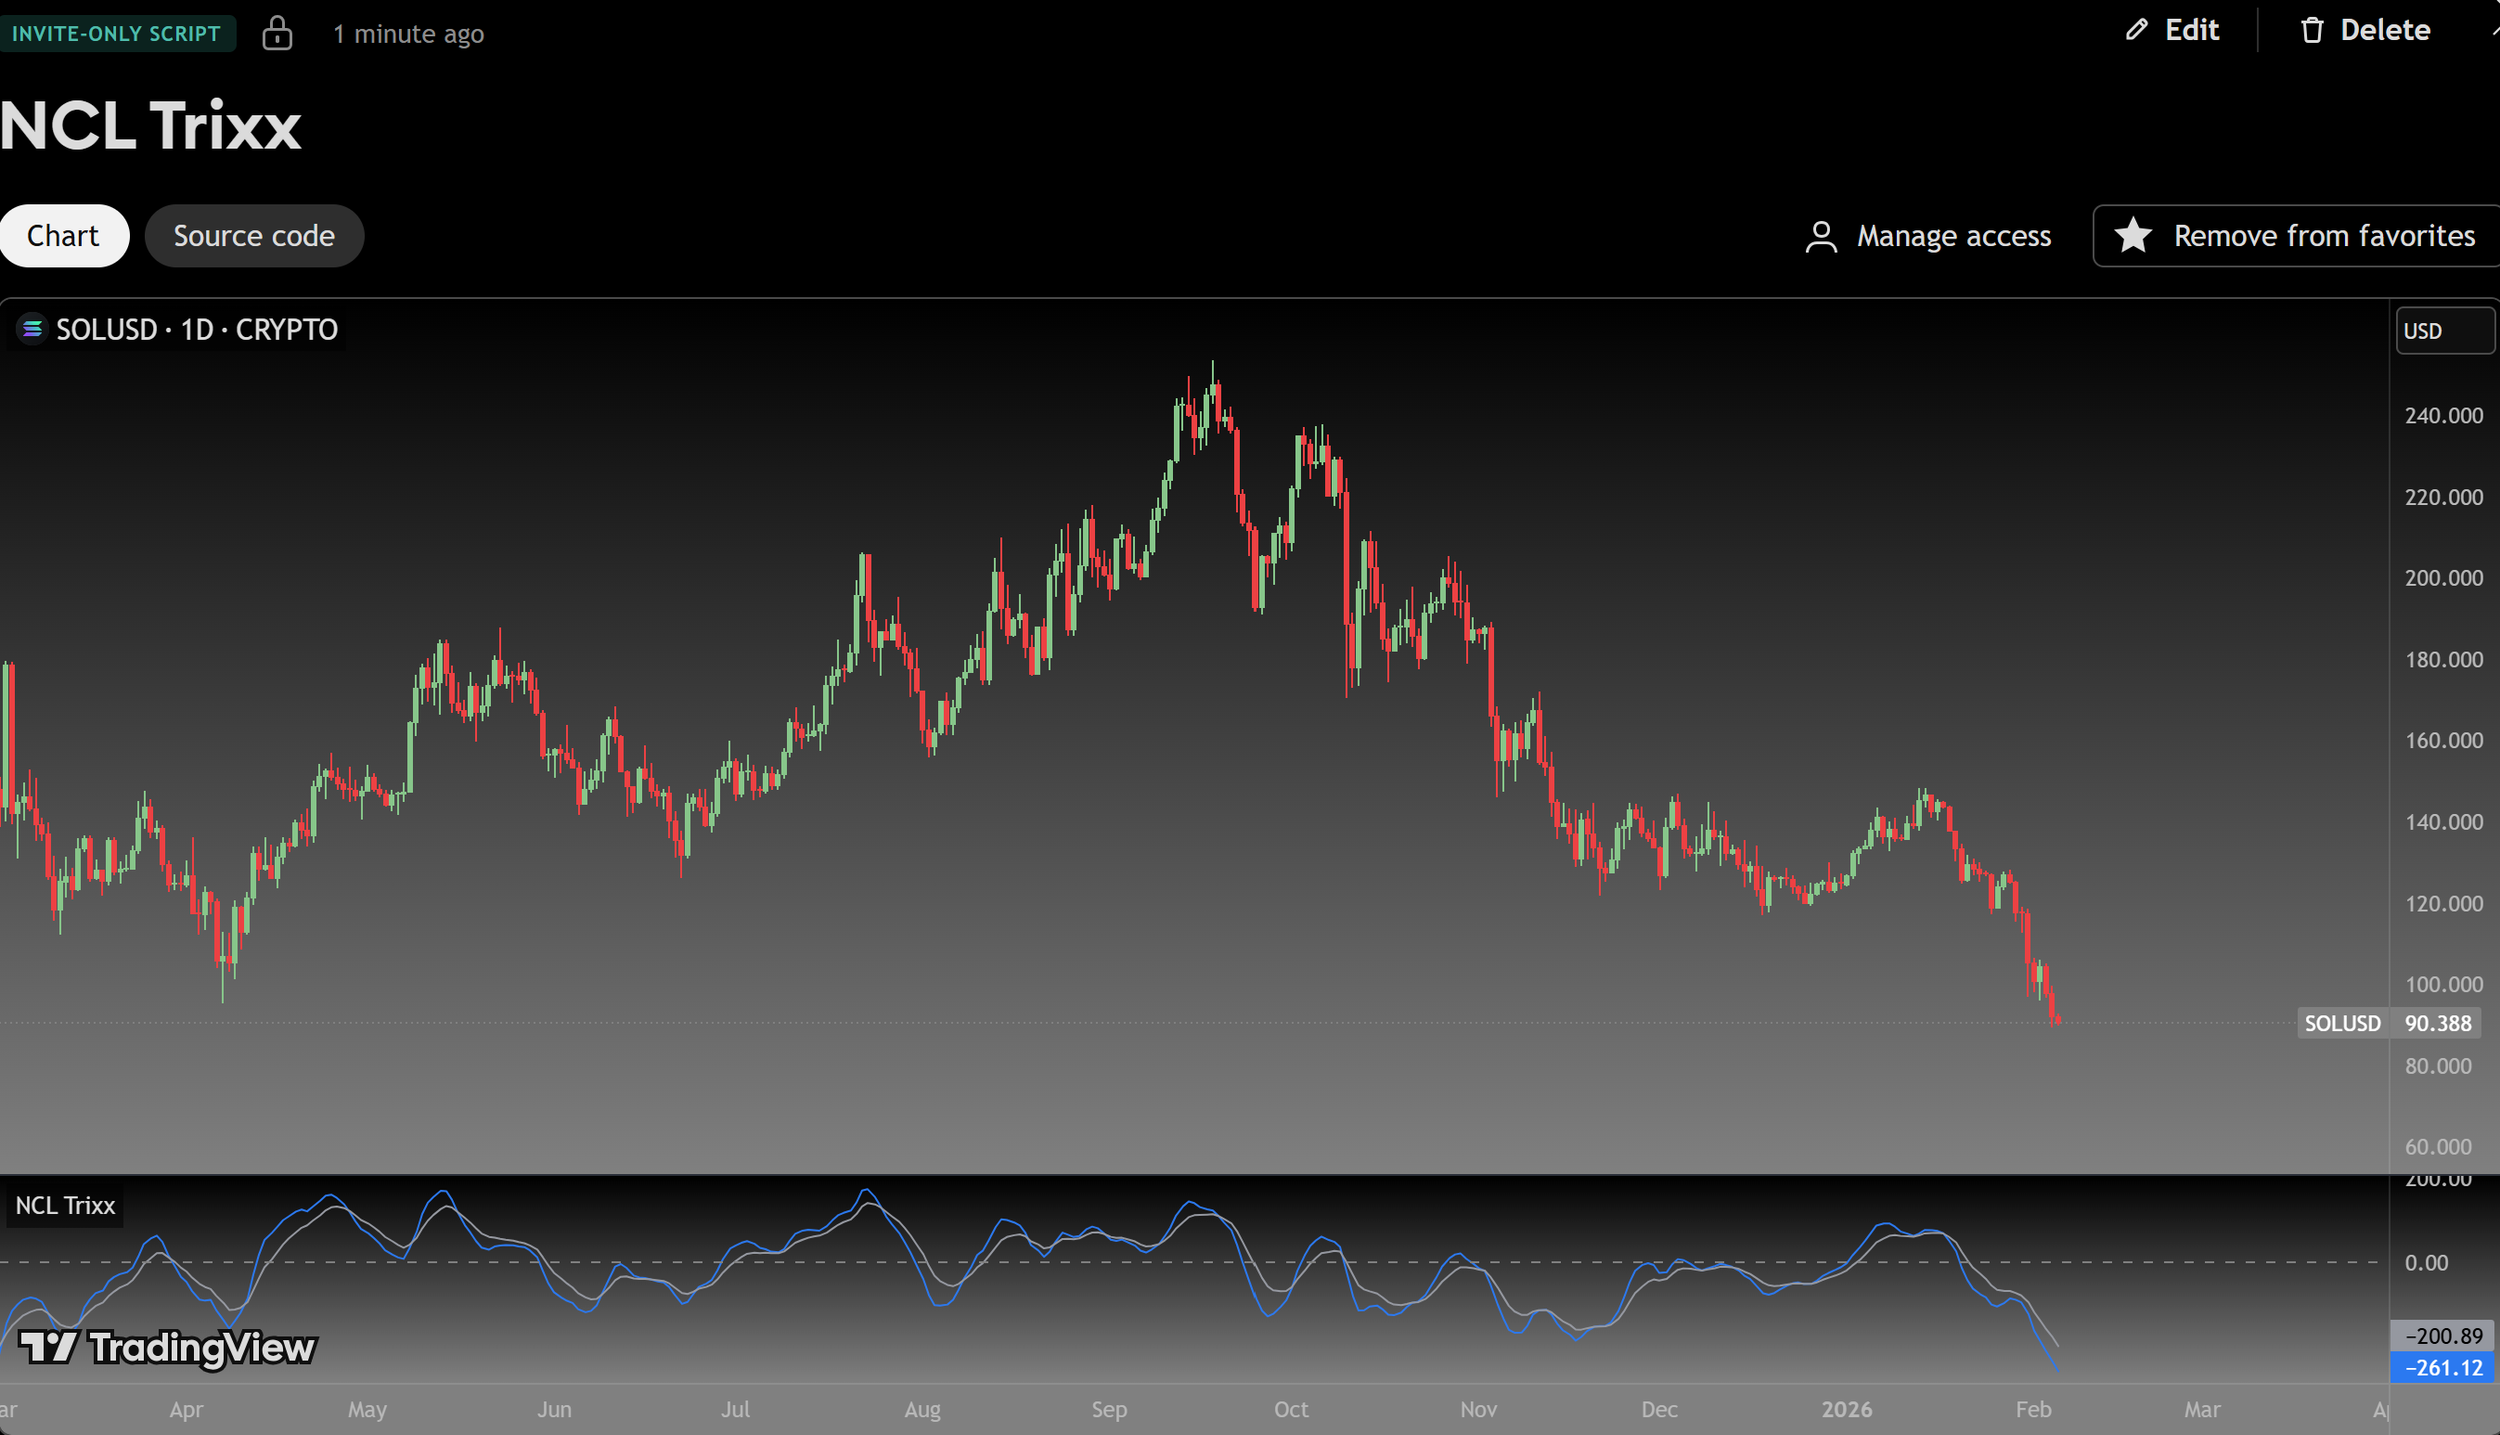
NCL Trixx
One of our Favorite Indicators - The Trixx - The Trix with K & J lines for extra crossovers and trend analysis. Best when used on the 4hr and above.
Shout out to fauxlife for the original script, we updated to v6.
The TRIX indicator (Triple Exponential Average) is a momentum oscillator used in technical analysis to show the percentage rate of change of a triple-smoothed exponential moving average, helping traders identify overbought/oversold conditions and potential trend reversals by filtering out minor price fluctuations. It plots as a line oscillating around a zero line, often with a signal line (an EMA of TRIX) for crossovers, and traders look for divergence with price or signal line crosses for buy/sell signals